by Jason Bodner
November 4, 2025
I saw Willy Wonka and the Chocolate Factory as a kid. There’s a scene where Charlie’s grandfather and he try a super-fizzy body-lifting drink. It works, and as they float toward the ceiling, they get dangerously close to the fan. The sharp blades spell doom – until they realize that if they burp, they’ll stop rising.
Sound familiar? Stocks have been floating higher in ways that make many investors nervous. We know it can’t last forever, and the higher we go without a “big burp,” the harder the fall. But guessing outcomes is usually a losing game, while studying and reacting to data lets us adapt when things turn unpredictable.
Some Wonka trivia: Gene Wilder only agreed to play Wonka if he could limp out and then suddenly do a somersault, to show his unpredictability. That’s how we should approach markets – expect surprises.
These days, many investors worry that we’ve floated too high, too fast, but what does the data say?
It’s true that the yellow flags are piling up. There are cracks in the market which could cause concern, but my approach is to keep emotion out of investing and focus on the data. I believe that this outlook creates better decisions, so before we get carried away, let’s break down and analyze what the data is telling us.
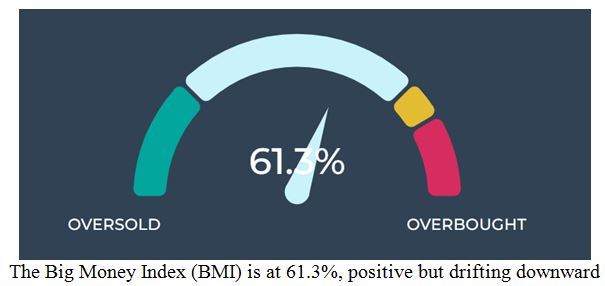
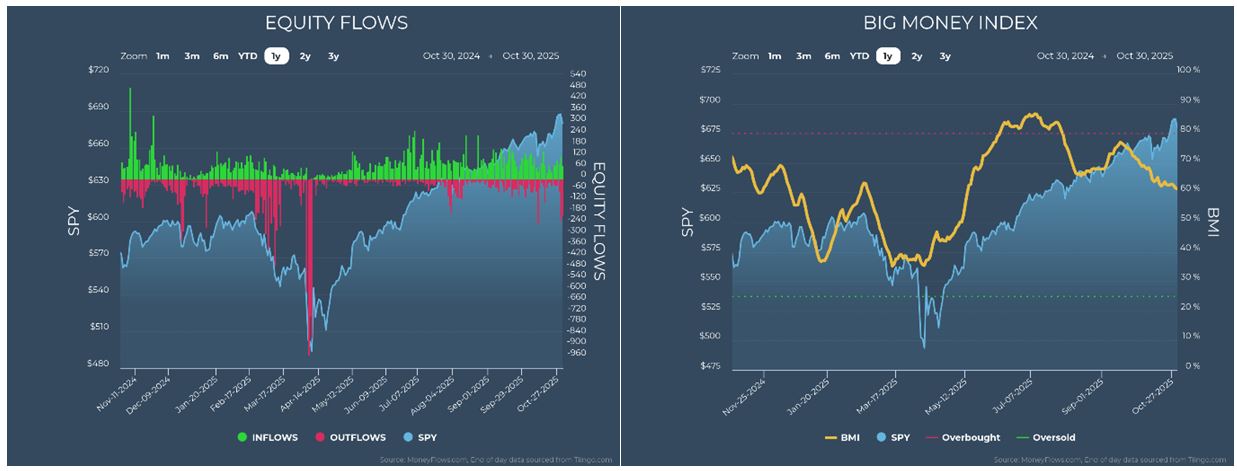
The Big Money Index continues to drift lower. After a bout of fresh outflows, the index came under new pressure. This is because it’s a 25-day moving average of net new inflows. If one day sees 75 inflows out of 100 signals, that day reads 75%. We average the last 25-days to gauge overall inflows or outflows.
The recent BMI decline comes from some weak inflow signals plus a sudden spike in outflows.
Graphs are for illustrative and discussion purposes only. Please read important disclosures at the end of this commentary.
Before addressing whether this trend will continue, let’s keep breaking down the data.
ETFs haven’t succumbed to major outflows yet, though we saw a slight uptick. On October 20, there were 18 ETF outflows – tied for second most (with October 10) since April 8, which saw 288 ETF outflows – the most extreme ETF outflow day in market data since 1990. Compared to that, 18 isn’t even a sniffle.
The post 11-4-25: What’s Elevating the Stock Market to New Highs? appeared first on Navellier.