by Ivan Martchev
August 12, 2025
Last week, I wrote about the trading range on July 31 and August 1, which became so volatile that it covered the whole trading range of the month of July in two days. This is statistically meaningful, since it constituted a 4-standard-deviation move relative to the S&P 500’s 20-day moving average.
Last week saw a reversal of that move. In fact, investors wanted to buy the dip so much that the NASDAQ 100 registered a fresh all-time high, and the S&P 500 came within about 30 points from its own all-time high as of last Friday, so, in a positive news-flow environment, the S&P may set a new high this week.
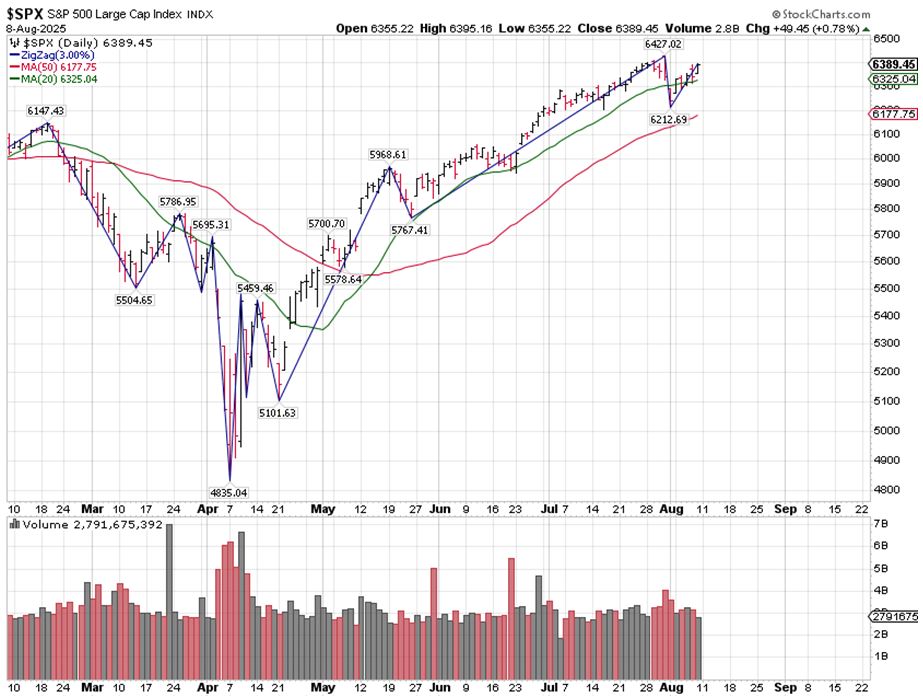
Every time market indicators point in one direction and then do the exact opposite of what they were first suggesting, we basically have a false signal. After a 25+% move in the S&P 500 since late April, we now have two moves marginally larger than 3% against the prevailing trend – one in mid-May and the other at the end of July. You can see those on the chart (below) by using a zigzag indicator set to filter out moves larger than 3% (and they are only marginally larger than 3%). If the CPI comes in better than expected today, and there are positive outcomes from the Trump-Putin war summit this week, it is likely that we will see further gains for stocks. And any positive news on the trade front may add further fuel to the fire.
There is no telling when a correction may start – it may wait until September. In other words, we could see the S&P 500 in the 6500-6600 range in a positive news-flow environment in August.
As convincing as the reversal at the end of July seemed, from a statistical perspective, there are now no indications that it was anything more than a “two-day wonder.”
Graphs are for illustrative and discussion purposes only. Please read important disclosures at the end of this commentary.
Furthermore, applying the zigzag indicator with a 3% filter, we can clearly see a head-and-shoulders bottom set in late April. The first shoulder, in March, is at 5787, the head is 4835, and the right shoulder is near 6000 (5968). These types of formations aren’t precise targets, but they could point to a best-case target for the S&P 500 of 7,100 by year’s end (the distance between the bottom and the right shoulder).
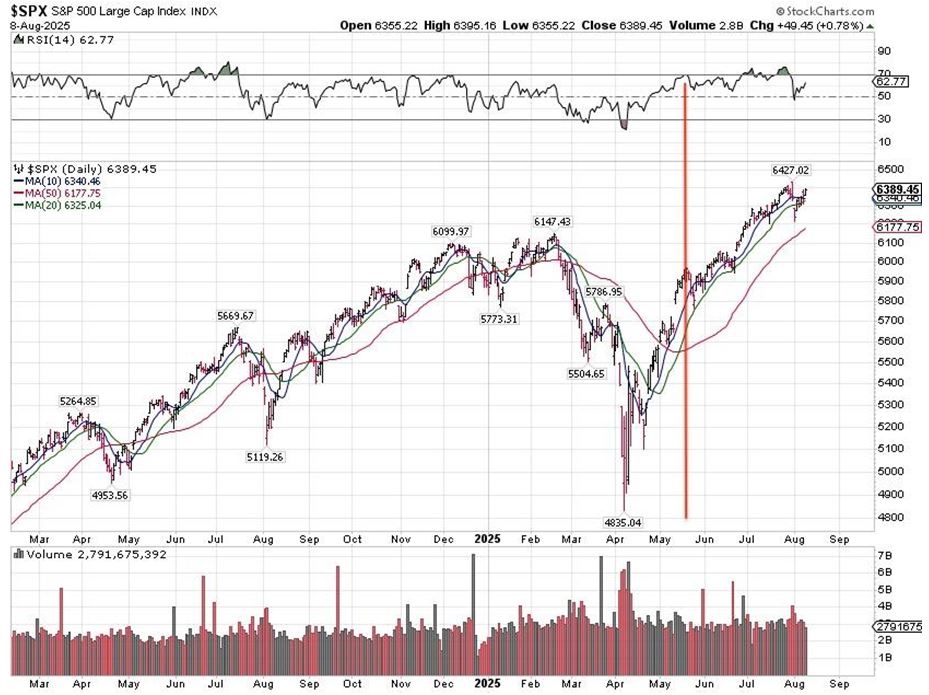
On May 20, 2025, when the market got genuinely overbought for the first time – taking the 2018-2019 bottom as a guideline (see “Overbought” Can Be a Nebulous Concept”) – I tried out a basic experiment, in which I figured out where we were at the time, if we were to follow a similar path to recovery.
Graphs are for illustrative and discussion purposes only. Please read important disclosures at the end of this commentary.
Since then, the S&P 500 is up 400 points and has performed better than I would have imagined – what I would describe as a “best-case scenario.” This clearly shows that “overbought” does not mean “sell,” and if the market can trend strongly, the pull-backs should be very shallow. So, yes, there will be a correction at some point, but it likely won’t come before we hit fresh all-time highs and get some traction. We are not as overbought as we were two weeks ago, and to get seriously overbought, we may have to hit 6600.
Since the Trump-Putin Alaska summit is set for August 15, I wonder what a truce/peace deal in Ukraine is worth to the S&P 500. In theory, it is worth a lot more to European markets, as I have heard many times that “If Putin takes Ukraine, he is going to take other countries,” which I never bought as a spin. But one less war in the world is definitely a positive outcome, and it should be celebrated by stock markets.
The post 8-12-25: Last Week’s “Reversal of the Reversal” appeared first on Navellier.