by Gary Alexander
November 4, 2025
With Daylight Savings Time now dead and buried – may it never rise again – we are back on natural time, when sunrises and sunsets happen in real (not artificial) time. But as we set our multiple clocks and watches back an hour – just as we enter the market’s best historical six months – it might be a good time to ask why some market timing gurus try to convince us that we should divide the year into two halves, with May to October being “leave the market” time, and November to April being “market growth time.”
I’m referring to the longtime maxim advising us to “Sell in May and Go Away,” since over 90% of all the market’s gains since 1950 came from November 1 to April 30, with most of the risk in May to October.
This year, however, the opposite happened. Last November to April lost money, with March and April especially gut-wrenching, while every month from May to October was up – even August and September.

Graphs are for illustrative and discussion purposes only. Please read important disclosures at the end of this commentary.
So, if you followed the old rule and held stocks from November 1, 2024, to April 30, 2025, you lost an average 3% in the four major indexes. Then, if you sold on May 1st, you missed gains averaging over 25%. As I council here in spring, “Don’t sell in May, or Go Away.” This old trick doesn’t work anymore
There are many other problems with this strategy – like figuring and paying short-term capital gains taxes, plus commissions and other transactional frictions. You also miss the gains that come in those six warmer months. Historically, there is a basis for “Sell in May” in tax-free accounts, but that is history – not current events. In the 75 years since 1950, we’ve seen 148-fold gains in the S&P 500 in the six cold months (November-April), with only about 2% annual gains in the six warmer months (May-October).
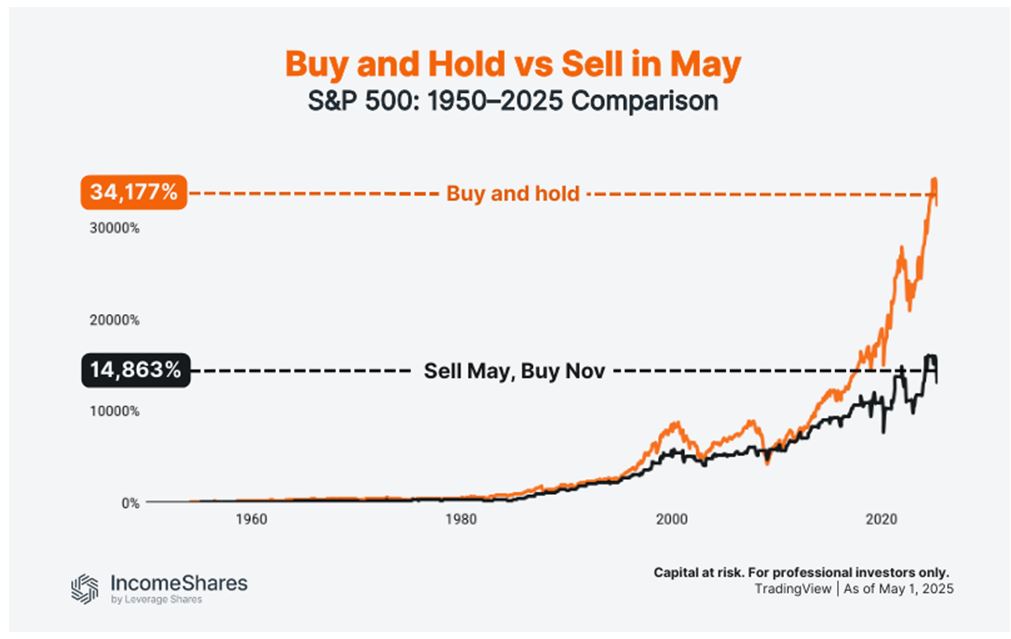
Graphs are for illustrative and discussion purposes only. Please read important disclosures at the end of this commentary.
Please notice that this chart ends “as of May 1, 2025,” so if you add the recent 22.8% gains since May 1st, the total buy-and-hold gains reach 41,965%, or about 180% more than “Sell in May and Go Away” (not counting taxes and commissions), but my main point is that what once worked well, does not work now.
Obviously, the anticipated downdraft in late summer never happened in 2025. The two worst two-month period, August and September, usually delivers a late summer slump, but this year August and September delivered a combined +5.5% in the S&P 500, +7.3% in NASDAQ and a shocking +10.1% in the Russell 2000, as stock market breadth obviously expanded from a few high-flying mega-stocks to their smaller brethren. The days are gone when you can say nearly all our gains come from six or eight-stocks.
Another common calendar maxim is that the fourth quarter delivers more gains than the other three quarters combined. That rule has held up well in the last few years. After an unfortunate and unfounded stock market collapse in the final quarter of 2018 – due mainly to a tweet storm by the President against the Federal Reserve chairman (sound familiar?). Then, Chairman Powell responded by raising interest rates one or two times too many, so the market fell almost 13% in the fourth quarter of 2018. Since then the final quarter has been nothing but roses and lollipops for stock investors, as reflected in these gains:
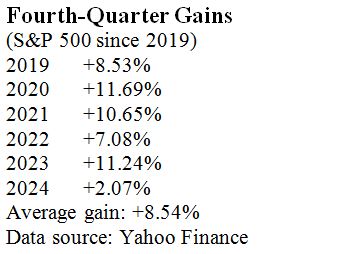
So far in the fourth quarter, we’ve seen 2.27% gains in October, but this is no guarantee of another booming fourth quarter. For some more solid hints about the future, we must look at the fundamentals.’
The Fundamentals Point to a Rousing Finale to 2025
Markets tend to rise in the fourth-quarter for more reasons than calendar coincidence. There are some technical reasons, ranging from portfolio rebalancing to tax planning, but the main reason is the sense of national hope we feel on entering a new year, combined with good times enjoyed in the holiday season.
In addition, here are a few fundamentals unique to this year’s closing two-months:
#1: Corporate earnings are off to their best start in four years, according to Bloomberg
#2: President Trump’s team is negotiating favorable trade deals, most notably in Asia
#3: We will likely see three total Fed interest rate cuts in late 2025, including December
#4: Most American taxpayers and businesses will pay lower taxes under the Big Beautiful Bill
#5: There is still plenty of cash on the sidelines, available to fuel the next stock buying surge
These fundamentals are mostly new to 2025. A year ago today, when the election was still undecided, we didn’t know if the policies of Kamala Harris or Donald Trump would prevail. As a result of confusion about the future, 2024’s fourth-quarter S&P 500 rose only 2%, its weakest performance since 2018, but the market is now rising over the impact of economic policies under President Trump, not the calendar.
These calendar formulas are based on history. You can create any number of similar correlations – from election results to Super Bowl winners, or horse races or hemlines – but correlation is not causation. Just because a coin flips to heads 50 times in a row – or even 30 of 50 – that does not mean that it is “more likely” to be heads in the future. This is where some very smart (Nobel Prize winning) economists and traders stumble. Just because a currency has a narrow trading range for 20 years does not mean it will stay within that range this year. (That’s the fallacy behind Long-Term Capital Management’s big leveraged bet in 1998. They anticipated that the Russian ruble would stay in its historical trading range, but Russia devalued its ruble in August 1998, so that huge hedge fund failed and had to be bailed out by the Fed).
You hear this “rear-view mirror fallacy” all the time – in the markets, or in sports. As I write this on late Saturday, announcers on Game 7 of the World Series said that the Dodgers have a long history of losing when they trail going into the ninth inning, which was their situation at the time. The Dodgers have won only two of 65 of their many World Series games trailing that late. That yields a 3% chance of winning, if you believe in the record of similar historical situations, but then a home run by a weak hitting infielder tied the game, then a miracle catch by a center fielder who had just entered the game, preventing a loss, then another homer by the Dodger catcher was the winning home run in the 11th in a miracle comeback.
So, don’t bet on history repeating itself. That which we fear most is least likely to happen, since we take extra caution to prevent it happening again. Today’s market does whatever it needs to do to surprise us.
The post 11-4-25: Is Wall Street’s Investment Clock Broken? appeared first on Navellier.