by Gary Alexander
October 7, 2025
Last week, I reported here that the GDP growth was robust (near 4%) in both the second and third quarters of 2025. However, I spoke prematurely, before consulting the all-important “Gross Output” (top-line, more business-oriented) statistic, which only comes out once each quarter, unlike GDP estimates.
The official final GDP growth rate in the second quarter was +3.8%, but real Gross Output (GO) in the same quarter increased only 1.2%. In contrast, GDP was negative in the first quarter (-0.6%) and super-charged (+3.8%) in the second quarter, in an extremely wide swing. GO is primarily composed of private goods-producing industries, which rose 0.6% in the quarter, and private services industries (+ 1.7%).
Here’s how GDP and GO numbers compare in the first half of 2025 – all in real annual growth rates:
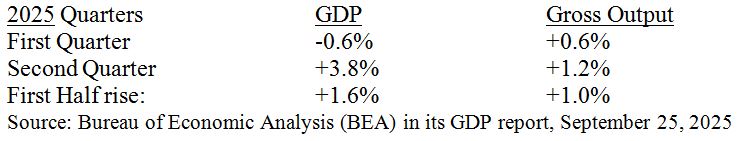
A rapidly growing GDP seems at odds with a more downbeat trend in business growth. Such a wide quarterly gap between the two output measures stems from their different definitions and different market measures. Gross Output is business-oriented production in advance of final sales, while retail sales dominate the GDP, as reflected in the common statement, “The consumer is two-thirds of the economy.”
That statement (in quotes above) is false, or half-true. The consumer represents about two-thirds of GDP, but only about one third of the total economy, including the earlier stages of production. This insight was thoroughly examined in Mark Skousen’s 1990 book, “The Structure of Production,” and Skousen makes it a point to report Gross Output each quarter, while many economists tend to overlook this vital metric.
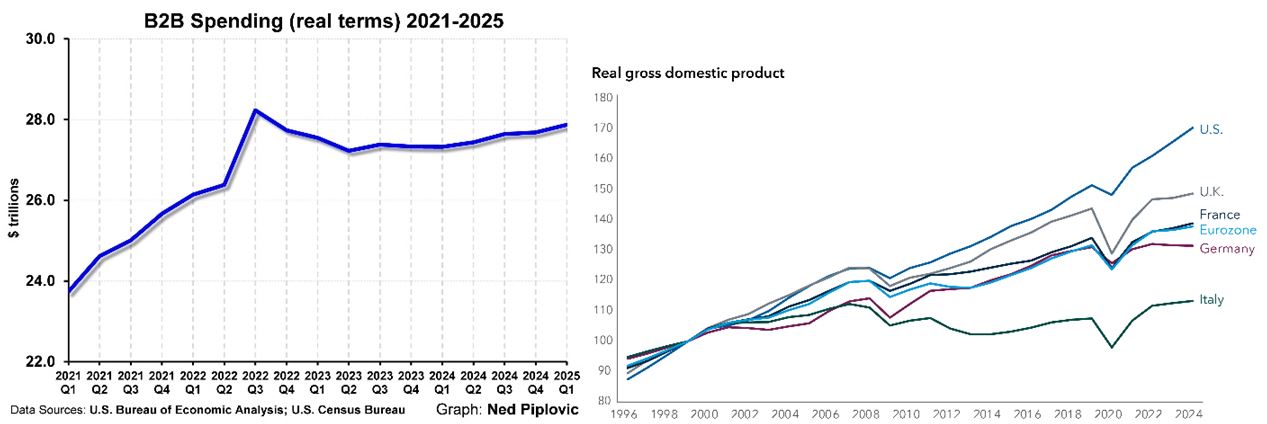
Skousen’s Business-to-business (B2B Spending) index has been basically flat since 3Q’2022 (left chart, below), while GDP has risen sharply – as reflected in the surging growth spurt of U.S. GDP (top right):
Graphs are for illustrative and discussion purposes only. Please read important disclosures at the end of this commentary.
Writing in last week’s Wall Street Journal, Dr. Skousen said that, if we dig into the numbers, we will find “the trade war is in fact wreaking economic havoc.” Gross Output in the second quarter came in less than one-third the growth rate of the second-quarter GDP, so “GO” isn’t “going” anywhere. It is “slowing to a crawl,” in Skousen’s view, adding significant details: “If you include all transactions in wholesale and retail trade, the adjusted GO is up only 0.3%. More important, I calculate that overall business spending fell sharply, by an annualized 5.6% in real terms. For the first time since the financial crisis of 2008, we are seeing a huge gap between consumer and business spending. While consumption is still robust (up a real 2.6%), business is pulling in its horns, largely due to higher tariffs and the uncertainty of trade war.”
Skousen says GO is flashing “yellow” now, since “when business puts on the brakes, employment slows, and recession strikes.” We’re not saying a recession is inevitable in 2026, as trade barriers can be lifted as well as raised, but the euphoria created by consumers buying more “stuff” can be a misleading indicator.
Two More “October Oriented” Market Trends Clarified
Now that I’m admitting that some of my coverage of economic statistics last week was premature (or incomplete), let me also expand on two of my stock market commentaries.
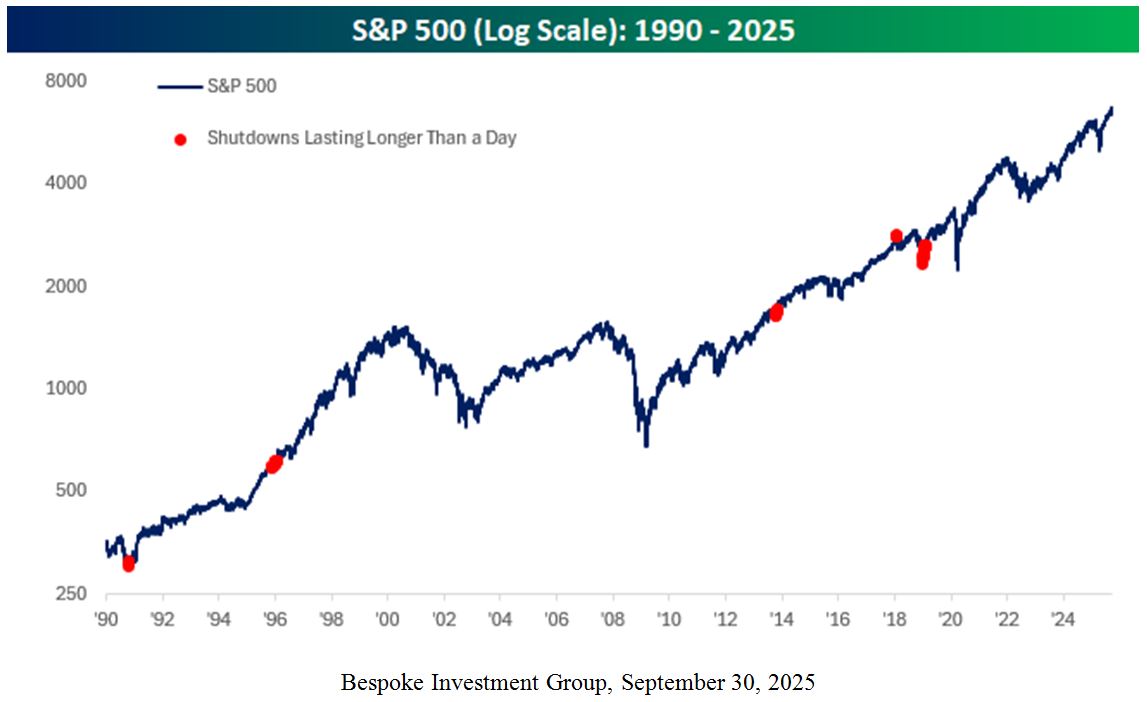
#1: Last week, I discussed the market’s superior performance following the three longest government shutdowns. That was accurate, but incomplete. The day we published this column last Tuesday, September 30, Bespoke Investment Group (BIG) put some flesh on the bones of my analysis by looking at all of the shutdowns of the last 40-years. Ignoring the two that lasted just three days (the equivalent of last Wednesday through Friday, a “mini-shutdown”), shutdowns lasting five-days or longer (like now) delivered 10% gains in the S&P 500 three-months after the shutdown began – and +22.5% a year later.

All of these shutdowns began in the fourth quarter, with the first two happening in the same year (1995, with President Bill Clinton vs. the aggressive new Republican House, demanding revolutionary changes), but these two 1995 shutdowns didn’t touch the massive Internet and Tech revolution of the late 1990s.
The 2013 shutdown (under Democrat President Barack Obama and a Republican Congress) was mostly fought over funding Obamacare, and it delivered the lowest 1-year gain, at just 14.8%, while the latest shutdown (under Republican Donald Trump and a new Democratic House) delivered the strongest gains.
We can’t promise 16% gains this quarter (as in the 2018 shutdown), or 22% within six months or 33% in the next year, but this shutdown should be able to deliver the average shutdown totals listed above.
As Bespoke titled their bullish report on past shutdowns and the stock market – “Bring it On!”
Graphs are for illustrative and discussion purposes only. Please read important disclosures at the end of this commentary.
#2: The second statistical amendment I must address is the nature of the market’s rise during October in history. Specifically, I would like to add two important asterisks for that number:
October is the most volatile month, with the most 1% or greater declines of any month on the calendar:
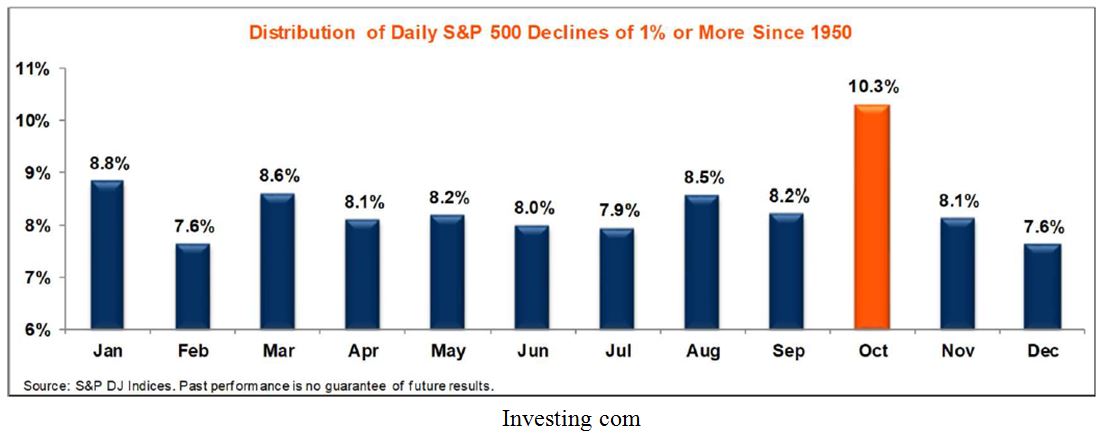
Graphs are for illustrative and discussion purposes only. Please read important disclosures at the end of this commentary.
Also, October’s net gains in the 42-years from 1983 to 2024 came in the last four-days of the month. The blue line (below) shows no net gain as of October 28, then the entire 0.9% monthly gain, October 28-31.
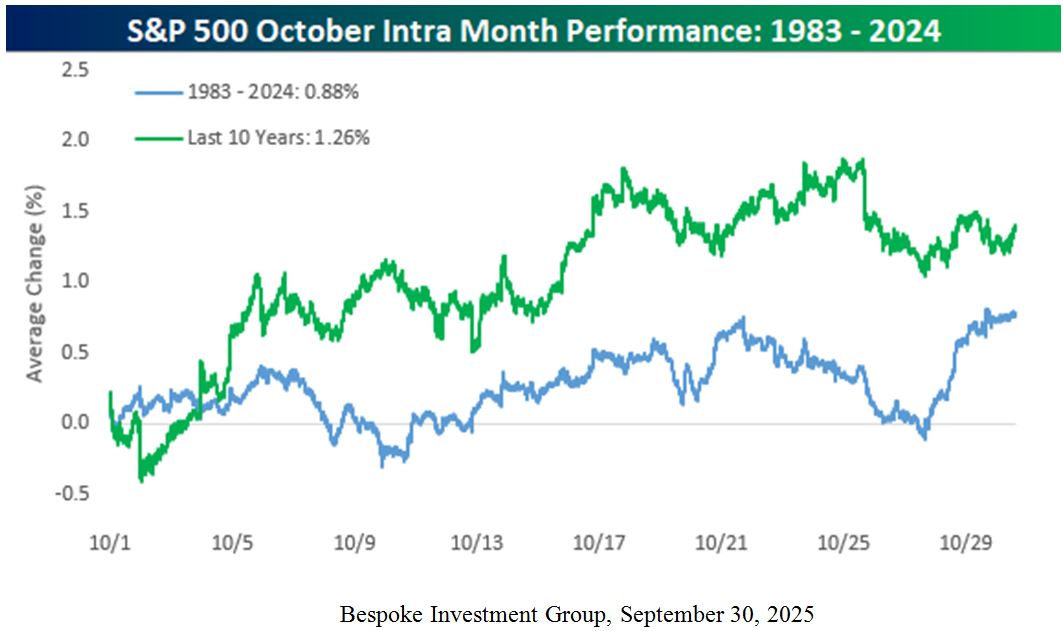
Graphs are for illustrative and discussion purposes only. Please read important disclosures at the end of this commentary.
Despite this historically late start to October’s gains, and those in the fourth-quarter, the fourth-quarter is still the best quarter in market performance, by far. Since 1998, we have seen far more total gains (951%) than the other three-quarters combined (754%). In the previous seven-decades, as the chart shows, the four-quarters were far more closely bunched in total performance than the surge since 1998 (chart, below):
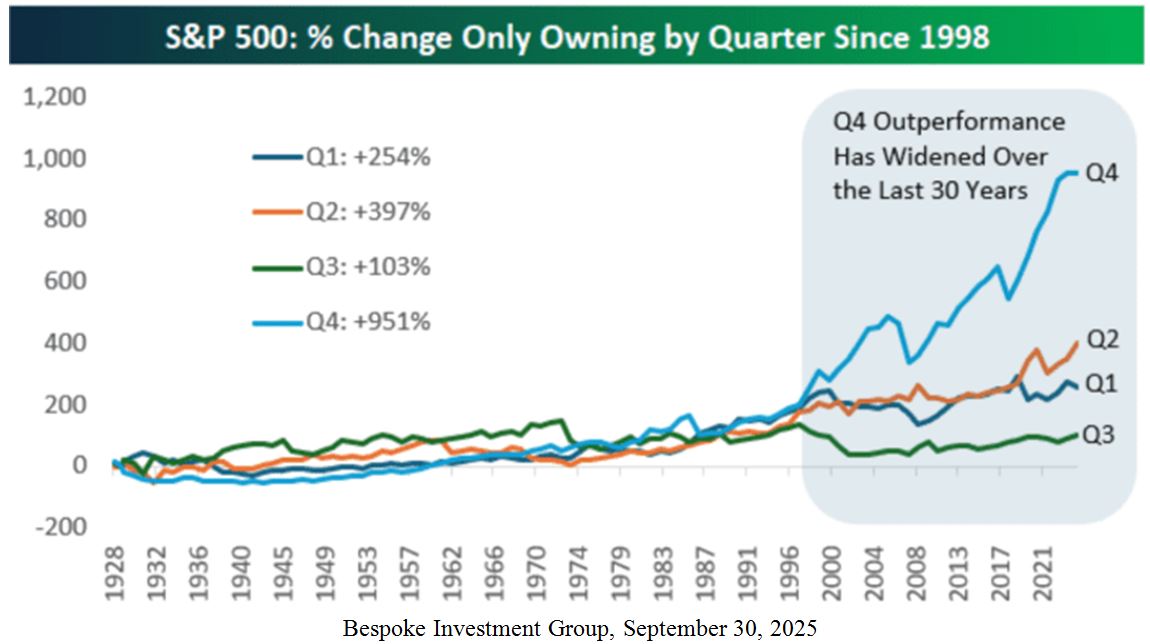
Graphs are for illustrative and discussion purposes only. Please read important disclosures at the end of this commentary.
So, thank you, Bespoke, for your fine research and help in clarifying the details of my previous column!
The post 10-7-25: Low “Gross Output” Implies that GDP May Over-Estimate Growth appeared first on Navellier.