by Gary Alexander
August 5, 2025
Last week, I wrote about the reasons why August went from being the best market month for nearly a century (1896 to 1986, in Dow terms) but then became the worst month over the last 40-years or so.
In this issue, I’d like to review four of the worst Augusts since 1990 to indicate what we MIGHT have to endure this month. Since this is the start of Hurricane Season, I’d like to name these August storms:
Four Sharp August Declines … And the Massive Bull Market Recoveries that Followed
Don’t get me wrong. I wouldn’t sell stocks out of fear of a late-summer swoon (“Sell in July – and Wonder Why”), since about 59% of all Augusts rise, and markets tend to recover fast from any disaster by setting new highs in the fourth quarter in many years. Market timing seldom works, as the market seems to do whatever it takes to shake out the “weak hands” and reward those who realize the main market bias is UP.
Here are the four worst Augusts since 1990 – and what happened next:
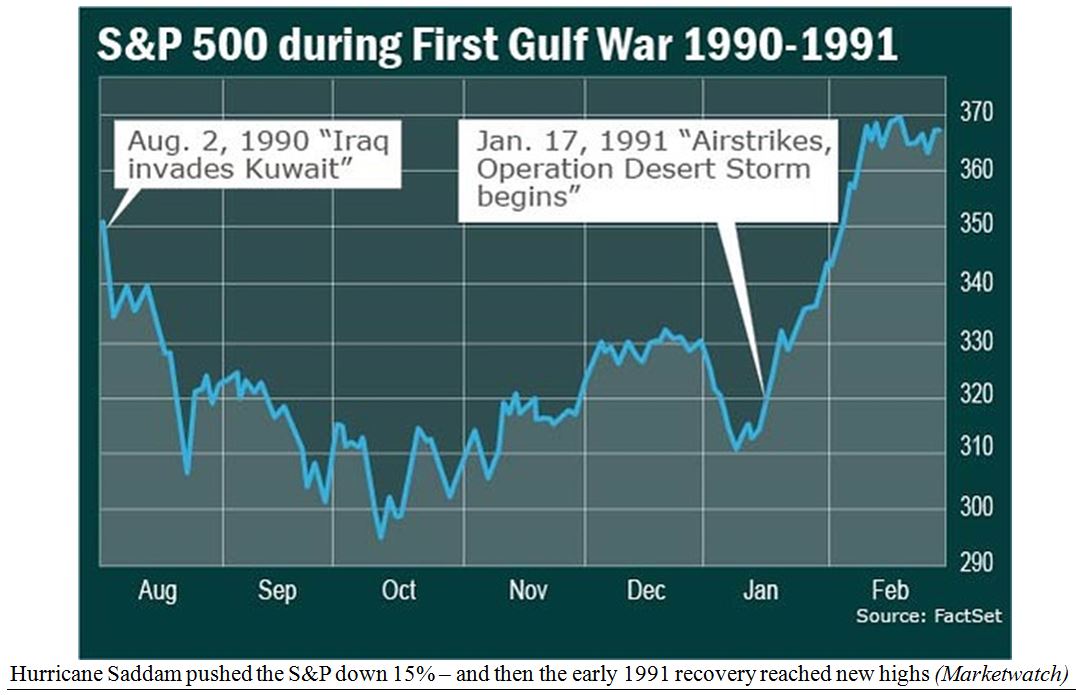
#1: Hurricane Saddam (August 1990) resulted from Saddam Hussein’s sudden surprise attack on Kuwait on Thursday, August 2, 1990. The Dow lost 35 points that day, then 55 points on Friday, and 93 points on Monday, August 6. In the first five trading days of August 1990, the Dow fell 195 points (-6.7%).
Three weeks after the attack (on August 23), the Dow was off almost 15% and the price of oil had doubled. from $20 to $40. (In others news on August 23, East and West Germany announced that they would unite).
The basic point to remember in all these stories is that markets recover. The pundits predicted that once the Western allies invaded Kuwait and Iraq, stocks would tank and gold would soar, and then the war might last up to a decade – like the recent 9-year Russian occupation of Afghanistan, or the 8-year Iraq-Iran war.
The opposite happened. The main Kuwait liberation of January 1991 lasted all of four days, with another five weeks for clean-up and decimation of Iraq’s defenses. After the battle began in mid-January 1991, the Dow shot up 16%, from 2500 to 2900, in just one month, and by the first anniversary of Saddam’s invasion of Kuwait (on August 2, 1991), the Dow topped 3,000 for the first time in its then 95-year history.
Graphs are for illustrative and discussion purposes only. Please read important disclosures at the end of this commentary.
#2: Hurricane Ruble (August 1998): After a scary August 1997, at the start of the Asian Currency Crisis, the mother of all currency crises came in August 1998. Despite several currency crises in the 1990 (like the collapse of the British Pound in 1992, the Mexican Peso collapse in 1994 and the Asian currency crisis in 1997), some Nobel-Prize-winning market risk analysts at Long-Term Capital Management (LTCM) were totally surprised by the rapid fall of the Russian ruble. Since they used high leverage to trade “normal historical spreads,” they did not anticipate the wider-than-normal ruble collapse. In fact, they were so highly leveraged that they were about to collapse and bring Wall Street down with them, if not bailed out.
The crisis began on Tuesday, August 4, 1998, when the Dow fell nearly 300 points (299.43, to be exact) in the first of several scary days that August. By August 25, the Dow recovered to an interim peak of 8603, only to fall by over 1,000 points in the next four trading sessions, down to 7,539 (down 12.4% in less than a week). For all of August 1998, the Dow fell by a then-record 1,344 points (-15.1%) from 8,883 to 7,539, the largest monthly point drop in history, to that date, but exactly a year later (on August 31, 1999), the Dow was up 43.7%, the S&P 500 gained 38%, and the red-hot NASDAQ had risen 82.7% in 12 months.
Graphs are for illustrative and discussion purposes only. Please read important disclosures at the end of this commentary.
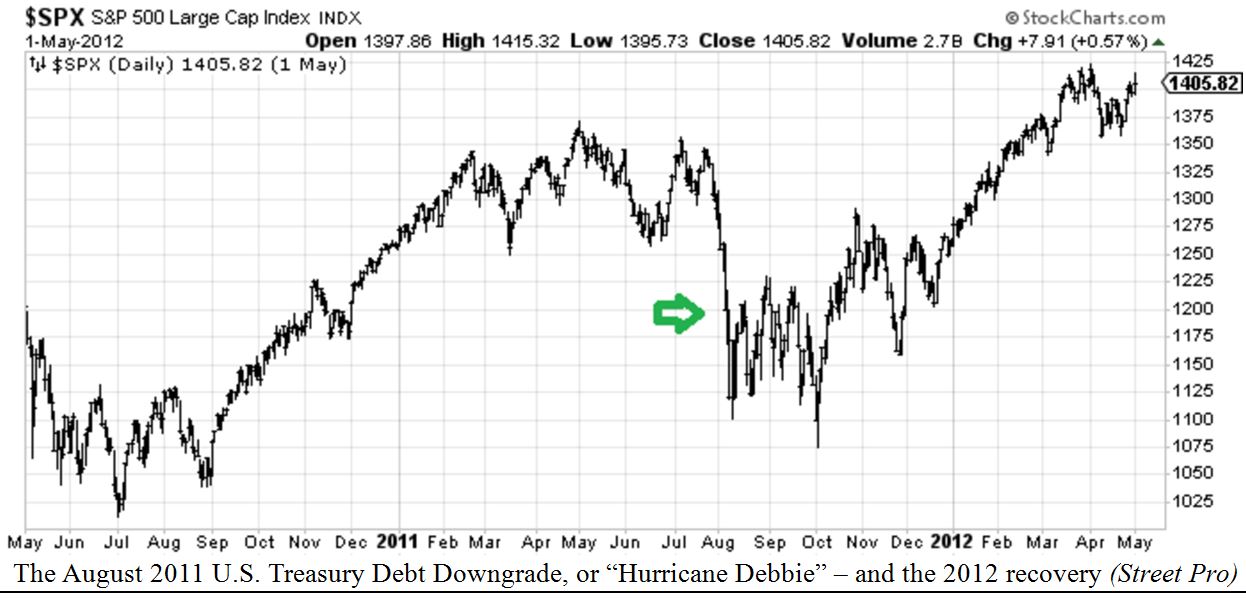
#3: Hurricane Debbie (August 2011) – my shorthand for the Debt Bomb Hurricane: In August 2011, the Dow and S&P 500 fell “only” 6.4%, but that number masks a horrid beginning – down 13% August 1-8 in the S&P 500, including a 6.7% drop on Monday August 8th and a 4.8% crash the previous Thursday.
In fact, August 8 (8-8) defied all the good omens for the number “8” (in China, at least) by becoming the new Black Monday on Wall Street, making investors forget that first Black Monday on October 19, 1987.
The cause of the decline was a massacre in U.S. bonds, due to a credit downgrade issued by Standard and Poor’s, which demoted U.S. sovereign debt from “AAA” (top-rated, or risk-free) to the next lower notch, AA+. This was the first time in U.S. history that U.S. Treasury debt was downgraded – it didn’t happen after the 1929 market crash or Great Depression, but over a kerfuffle in Congress regarding a debt ceiling!
On Black Monday, the Dow fell 5.55% and the S&P 500 fell an ominous 6.66%, while NASDAQ fell 6.9%, but a year later – measuring from the end of August – the Dow was up 12.7%, the S&P 500 rose 15.4%, and NASDAQ had risen 29.3%. In an opposite but nearly equal market move, gold rose 26% from $1,512 on July 5th to $1,912 September 5th. A year later, on September 5, 2012, gold had fallen to $1,691.
Graphs are for illustrative and discussion purposes only. Please read important disclosures at the end of this commentary.
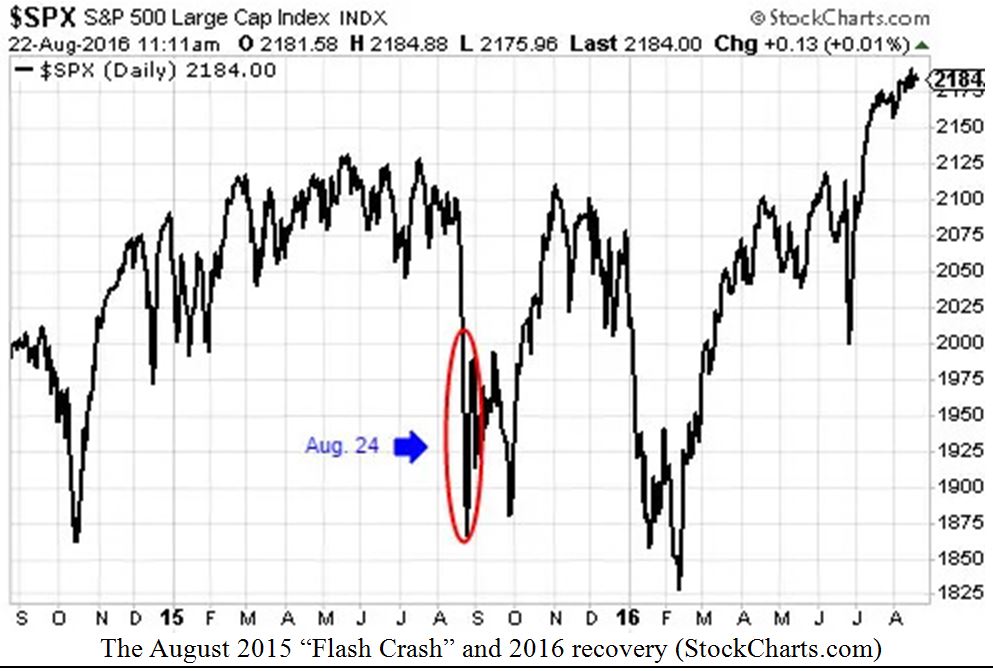
#4-Hurricane Flashdance (August 2015) was an even shorter crash than the one-week (August 2011) drop. The market was down 6% to 7% in the major indexes, but 2015 was a perfect example of what can happen when too many high-level market movers are taking their annual vacations, and the “B” team takes over the trading desks. August markets have generally lower volumes, so unscrupulous traders can stage a bear raid on some popular stock positions, scaring many traders and investors into selling prematurely.
The Flash Crash happened on Monday, August 24, when the Dow lost over 1,000 points (-6.6%) within minutes, spawning Internet headlines (click bait) telling us that this single move “wiped out” all the market gains made in 2015, to date. The headlines also screamed that this plunge had “wiped out” an estimated ten trillion dollars since early June. (Funny how headlines seldom say markets create profits, only losses).
Crude oil also fell to a multi-year low. But then, a funny thing happened. The Dow gained back those 1,000 points – and more – with a 1,300-point gain in three days. In the S&P 500, as this chart shows, the index lost over 10%, from about 2,100 to 1,867, but the index had risen to 2,184 the following August.
Graphs are for illustrative and discussion purposes only. Please read important disclosures at the end of this commentary.
Investors who panicked during this Flash Crash – or who had “stop losses” set – lost a ton of money, as there was no bid on the way down on some stocks or ETFs. Intra-day, some exchange-traded funds (ETFs) fell by up to 35%, including some great dividend stocks in iShares Select Dividend (DXY) or Vanguard Dividend Appreciation (VIG). Shares dropped over 30% intra-day – even though their underlying holdings hadn’t fallen anywhere near that much. The result was total chaos. Stop-loss orders were triggered at horrid prices. Circuit breakers kicked in and regular investors got crushed by pricing errors didn’t see coming.
- DVY opened August 24th at $69.40, hit a high of $73.79 and a low of $48 (31% off the open).
- VIG opened August 24th at $71.74, hit a high of $75.47 and a low of $47.70 (-33.5% off the open).
These two ETFs rebounded to their pre-crash levels by the next day, but that didn’t help investors who sold, or who had their “stop loss orders” executed at the lows. (I’ve never instituted a stop loss for that reason. If I’m worried about a stock, I’ll sell maybe 50% but a “stop loss” (to me) means I will be taken out unwillingly at a price that may be well below my intended stop loss due to few bids.) Imagine setting a stop loss on Nvidia at $100 this year – which it hit last April. We’d miss out on all the gains since then.
The most important lesson is that Market Hurricanes come and go but we often see MUCH higher prices one year later, so I would just endure these temporary seasonal shenanigans without selling into a panic.
Navellier & Associates; own Nvidia Corp (NVDA), in managed accounts. Gary Alexander owns Nvidia Corp (NVDA), in a personal account.
The post 8-5-25: What to Do if Another Market Hurricane Strikes This August appeared first on Navellier.


