by Ivan Martchev
August 5, 2025
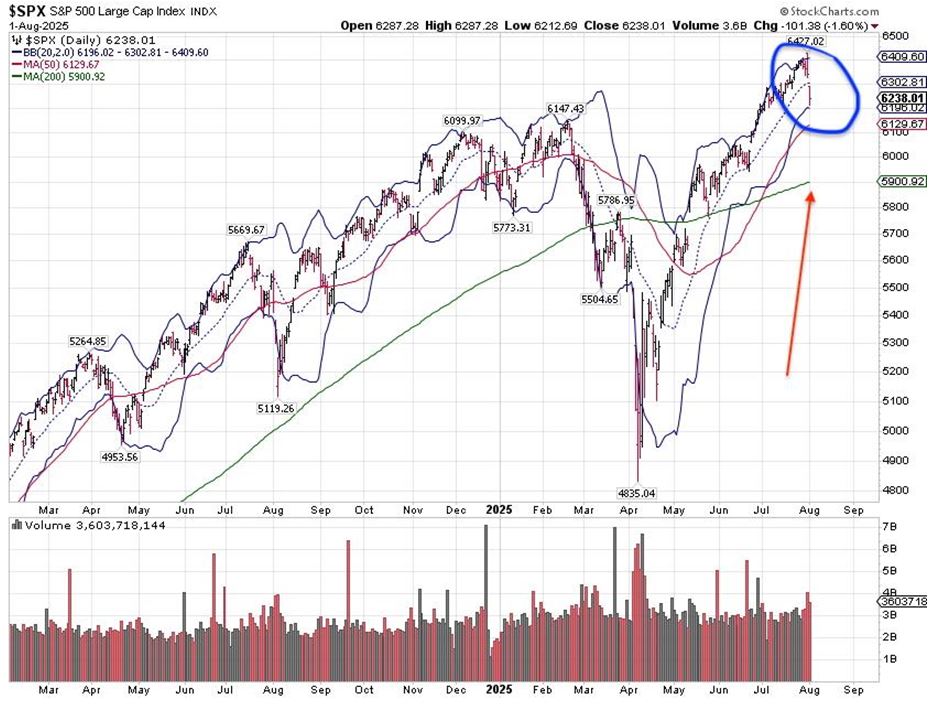
Standard deviation bands, better known as Bollinger bands, typically show an area that is two standard deviations to the upside and downside around a 20-day moving average (for more details see here). In the past year, we have not moved many times by four standard deviations within two days, but we had moves by four standard deviations in early August of last year and in early April (right after the tariffs were announced), but not once from the upper standard deviation band to the lower standard deviation band.
Since April 22, there was no daily change in the S&P 500 in the lower standard deviation band until last Friday, August 1. There was a lot of volatility between April 2 (Liberation Day) and April 22, but once we crossed over into upper standard deviation band territory on April 23, it was a rally for the record books.
Graphs are for illustrative and discussion purposes only. Please read important disclosures at the end of this commentary.
The stock market made a fresh all-time high on July 31, but on Friday the market appeared to have hit some quicksand. A correction after a 25% surge (since late April) would be normal, but there is something different about this decline. In the last trading day of July and first trading day of August, the S&P 500 travelled the whole trading range of July! That type of action reveals pent-up selling pressure.
Furthermore, trading in major stock indexes exhibited some classic reversal patterns. Thursday’s trading showed a daily “bearish engulfing pattern” in both the S&P 500 and the NASDAQ 100-indexes. These indexes are very heavily correlated, as the NASDAQ 100-houses the largest economic sector of the S&P 500 (technology) and the largest cap names in the S&P 500. Curiously, in both the SPX and NDX indexes, there were also weekly bearish engulfing patterns: They opened above and broke out to new highs above the prior week’s highs and took out the prior week’s lows at the end of last week.
While Yogi Berra correctly observed that, “It’s tough to make predictions, especially about the future,” I will venture some of those “tough” predictions here. First of all, corrections tend to be a function of the preceding rally. The bigger the rally the bigger the correction, in most cases. In other words, I think this is not going to be a one-day wonder but perhaps the start of an intermediate-term correction.
Where could this correction go? Nobody knows for sure, as that would imply advance knowledge of future economic and geopolitical events before they have happened – and insight into how the market will digest them. But, if the market is up a lot in a short period of time, as it has demonstrated since late April, and then suddenly it is hit with bad economic numbers – like a weak employment report – that would tend to produce selling pressure. Then, we have U.S. nuclear submarines being moved closer to Russia last week, which is an escalation that does really achieve anything and makes the U.S. stock market more nervous.
One thing we have learned about the Russians during this Ukrainian war is that they do not respond well to sanctions and pressure, as they feel threatened by NATO expansion into nations on their borders and would do a lot to stop that trend. I am hopeful that the war ends this year, but it looks to me, after more than three years of fighting, that the Ukrainians will “lose face” fighting a bigger and better equipped force, despite doing a brilliant job of defending themselves. It seems to me that the fighting in Ukraine is intensifying right now and this, by definition, is negative for the stock market, particularly for the European markets.
A good target for a coming correction would be down to the 200-day moving average, now near 5,900 (red arrow on the above chart), a number which is rising. Typically, a rising 200-day moving average provides very good support, although we discovered in April that extremely high tariffs can override any bottoming action and push the stock market much lower. I do not believe we will experience anything similar to what we saw last March and April. Instead, we should see a more normal correction.
The Trump Administration has not gotten the trade deals it wants, but it has gotten a lot of important ones in the books. That is a “glass half-full” situation. For the correction to be shallow, we need the economic data to hold up. It is way too early to extrapolate last week’s jobs numbers into something bigger. We can get a bad employment report even in a good economy because the trade war raised the level of uncertainty, which would tend to postpone major hiring decisions. Congress must also get serious about cost cutting.
The post 8-5-25: A Sudden “Four Standard Deviation Move” In the S&P 500 appeared first on Navellier.


