by Jason Bodner
July 15, 2025
The earth’s rotation has been slowing gradually over eons. In fact, 250-million years ago, dinosaurs had a 23-hour day. That’s because days are getting longer by an estimated 1.8 seconds every 100-years.
Clearly this won’t affect you or me, but it might be of some interest to the odd surviving dinosaur.
If the earth is gradually turning slower, then why did the earth speed up last week, on July 9, 2025. On that tariff deadline day, scientists reported that the Earth completed its rotation approximately 1.3 to 1.6 milliseconds faster than usual. Moreover, this is expected to happen again on July 22 and August 5. These milliseconds aren’t changing our lives, but it reminds us that things don’t always go according to plan.
The link here is that we seem to alternate between “slow” and “fast” market days. Economists, analysts, and prognosticators planned for the worst crash in years when Trump announced his tariff plan on April 2nd. An already shaky market finally panicked. Stocks sank along with sentiment. It got pretty ugly then.
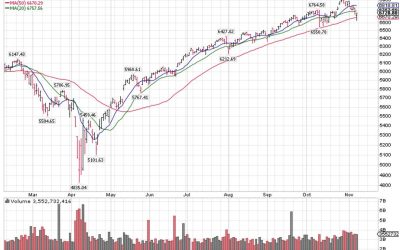
We all know what happened next: Just six calendar days later (four-trading days), stocks bottomed. Stocks wavered for a while, until May 12th, when Trump told the world he would delay tariffs for 90 days. The S&P 500 reacted by launching a stunning rally for the ages, which, as of July 11th, stands at a 26%+ gain.
The market defied logic but the investor’s biggest question remains: When will this rally end?
According to my data, not as soon as many fear.
This is based on current indications and, if the market has taught us anything, it is that tomorrow can surprise us. With that disclaimer, let’s see why I am still optimistic in what seems like peak optimism…
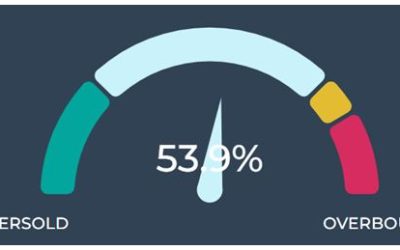
As always, let’s start with money flows. Money flows tell us everything we need to objectively assess market conditions. The Big Money Index (BMI) is a 25-day moving average of all inflow-outflow data. It went overbought on June 10th and hasn’t looked back since. There are a few important lessons here:
- Since 1990, the historical average duration of an overbought BMI is 22-trading days. As of this writing (July 11), the BMI has been overbought for 21-trading days. The worry might be that things will change tomorrow. However, if daily averages since May 12th persist (99-inflows, 41-outflows) then we will stay overbought through the end of July – another 13-trading days.
In short: there is no indication of overbought status changing soon. As a reminder, the post-COVID rally of 2020 saw the BMI overbought for a record-setting 87-trading days (four-months).

Graphs are for illustrative and discussion purposes only. Please read important disclosures at the end of this commentary.
- This market rise is happening on rising elevated trading volumes, which measure unusually large trades. Simply put, when a market rises on huge volume, that’s a clear risk-on indicator.
- When we look at daily inflow-outflow data in both equity and ETF flow, we see a clear pattern of steady rising inflow with virtually no recent outflows:

Graphs are for illustrative and discussion purposes only. Please read important disclosures at the end of this commentary.
We see the same clear pattern in both equities (left) or ETFs (right): investors are plowing into equities.
This all seems very bullish, but it flies in the face of the current news narrative (spoiler alert: Bullish views don’t sell as well as scary news). But the good news doesn’t stop there… it’s great to have big money flowing into stocks, but when we look at where the money is flowing, the message is brighter.
First, when we look at the distribution of inflows since Trump delayed tariffs on May 12th, we can see overwhelmingly, money flew into small-cap and mid-caps, which are typically associated with growth.
In fact, 84% of nearly 4,000-inflows went into stocks with capitalization of $50-billion or less:

Graphs are for illustrative and discussion purposes only. Please read important disclosures at the end of this commentary.
This is promising, but looking further we see the appetite for stocks has been for the sectors typically associated with high-growth. Looking below (left), we see the same data in graph form, broken down by sector. You can see that tech saw the lion’s share of inflows, followed by Financials, Industrials and Consumer Discretionary stocks. One narrative is that technology high growth historically has fueled our biggest bull markets in recent history. Financials are also collecting capital, perhaps because the environment is setting up for them to lend more and to fuel growth of small business, and thus small-cap and mid-cap stocks.
Industrials fuel infrastructure, ranging from keeping cloud architecture cool and functioning to building roads and bridges. Naturally, that could bode well for a growing economy. Discretionary stocks is perhaps the single best yardstick for investor sentiment. If investors dump discretionary stocks, they feel the prospects are dim for a strong consumer. If they buy, the opposite must be true.

Graphs are for illustrative and discussion purposes only. Please read important disclosures at the end of this commentary.
Let’s look at that trend another way… Here are all inflows since May 12th as broken down by sector. Here, we can see that 67% of all inflows in that two-month time span are found in these four sectors:

Graphs are for illustrative and discussion purposes only. Please read important disclosures at the end of this commentary.
If that’s not enough to excite you, let’s just look at each sector’s inflow-outflow data. The picture in each sector is crystal clear: Eight of the 11 S&P sectors have net inflows, with six of them sporting large net inflows. Again, we see the biggest inflows are in Industrials, Financials, Technology, and Discretionary. The three-sectors with low or zero net inflows are the most defensive: Utilities, Staples, and Real Estate:


Graphs are for illustrative and discussion purposes only. Please read important disclosures at the end of this commentary.
Looking at all this information tells me that this bull market can continue for a while. But seasonality has something to say about how long it lasts. Looking at the data we’ve collected since 1990, we can see that July is typically one of the strongest months of the year for stocks. Long ago, we were always told “sell in May and go away” right? But they really should have said: “Sell on July 31st and buy in late September.”
That’s because August and September are historically the weakest months in recent decades:

Graphs are for illustrative and discussion purposes only. Please read important disclosures at the end of this commentary.
We can see that clearly on the following chart:

Graphs are for illustrative and discussion purposes only. Please read important disclosures at the end of this commentary.
Markets might be defying logic, like seeing a sudden ‘short day’ in July. But the world won’t stop turning.
Tactically, right now, I am lightening overweight positions into strength and raising cash in order to buy into a historically high probability of a weak August and September. We never know what tomorrow brings, but if we focus on the data of today, we can help smooth the ride, or at least our anxiety.
“Even when there is nothing wrong, nor anything sure to go wrong in the future, most mortals exist in a fever of anxiety.”
-– Seneca…. But we don’t have to buy into those fears.
The post 7-15-25: Is The World Speeding Up or Slowing Down? (That Depends…) appeared first on Navellier.