by Gary Alexander
June 24, 2025
It was on a sleepy Sunday morning 75-years ago, June 25, 1950, that North Korean troops stormed into South Korea, as the first “hot” war of the 45-year Cold War began. Stocks fell fast that last week of June, but then they took off over the remainder of that war. Something similar happened when The Great War was triggered by an assassination in Sarajevo this week, on June 28, 1914. Stocks fell, then rose strongly.
I’ll cover those stories in more detail later on, but most eyes are now on Israel vs. Iran, where hostilities broke out on Friday the 13th of June – an unlucky day for most of Iran’s nuclear scientists – and then the U.S. escalated those hostilities when President Trump decided to enter that foreign conflict on June 21st.
As the war in Iran escalates, we are also keenly aware that the Russia/Ukraine war is now 40-months old and entering a “battle of the drones” stage as Russia’s fourth summer assault commences. Beyond those two major conflicts, we are also enduring the most number of hot wars since the end of World War II.
According to the Peace Research Institute Oslo, 2024 set a new record of 61-conflicts across 36-countries. PRIO’s Conflict Trends: A Global Overview said 2024 broke the previous record of 59-conflicts in 34-countries during 2023 – with both years recording the most global conflicts in any year since 1946.

Graphs are for illustrative and discussion purposes only. Please read important disclosures at the end of this commentary.
Africa is the most conflict-ridden region, with 28 state-based conflicts, nearly double the number from a decade ago. Asia had 17, and the Middle East had 10. Europe and the Americas had the remaining five.
The number of battle-related deaths reached 129,000 in both 2023 and 2024, according to PRIO’s report, tied for the fourth most deadly year since the Cold War ended in 1989. The highest 2024 death tolls were in the Ukraine war (76,000) and Gaza (26,000), with the remaining 27,000-deaths in 59 other conflicts.
PRIO Research Director and lead author of the report, Siri Aas Rustad, said, “This is not just a spike – it’s a structural shift. The world today is far more violent and far more fragmented than it was a decade ago.”
What’s most interesting to investors is that the S&P 500 rose strongly in both of those war-ridden years of 2023 and 2024, President Biden’s final two years in office. The S&P 500 gained 24% in both years, the strongest two-year market S&P rise since the late 1990s. NASDAQ staged an even more spectacular run, rising by 43.4% in 2023 and 30.8% in 2024, for an 87.6% two-year gain in those two blood-soaked years.
But gold did even better since the Middle East erupted in war. Since October 6, 2023, the day before Hamas invaded Israel, gold has outperformed stocks, virtually doubling the S&P 500 and NASDAQ.

Looking back further, we can see stocks tend to rise in times of war, but gold often rises even more, as a global crisis hedge. Measuring from the date when gold was free to move on global markets (1971), gold and silver reached their first peaks in early 1980, just after Russia invaded Afghanistan on December 27, 1979, and the metals rose again, 2001-11, beginning with America’s dual wars in Afghanistan and Iraq:

Graphs are for illustrative and discussion purposes only. Please read important disclosures at the end of this commentary.
Two Major Wars Began 75 and 111 Years Ago This Week — and the Market Mostly Rose
On June 25, 1950, at dawn on a Sunday morning, 200,000 North Korean troops stormed into South Korea. The next day, Monday, the Dow fell a staggering 4.7% (-10.44 points), to 213.91, the largest one-day drop since 1937, and the worst single-day decline we would see again until 1962. For the week of June 26-30, the Dow fell 15.24 points (-6.8%), to 209.11, the worst weekly drop since the 1930s.
On Thursday, June 29, 1950, President Truman declared a naval blockade of South Korea, and the Dow Jones index promptly fell by over eight points (-3.7%). Ironically, it was exactly one year earlier, on June 29, 1949, that the last U.S. forces were withdrawn from the South Korean peninsula. Only a skeleton 500-man military mission remained. A year later, of course, those troops, and more, returned to South Korea.
The stock market also reversed its direction in the second half of 1950, with the newly minted S&P 500 index rising 15.4% from June 30 to year-end, and +21.8% for the full year. Then, it just kept rising:


Graphs are for illustrative and discussion purposes only. Please read important disclosures at the end of this commentary.
On June 28, 1914, World War I unofficially began when Archduke Franz Ferdinand, heir to the Austro-Hungarian empire, was shot to death, along with his wife Sophia, by a Serbian nationalist in Sarajevo, Bosnia. Ferdinand was inspecting his uncle’s imperial armed forces in Bosnia, despite death threats made by Serbian nationalists. When Serbian nationalist Nedjelko Cabrinovic threw a bomb at their car, Ferdinand managed to deflect the bomb onto the street, but many, including Sophie, were injured.
Ferdinand’s wounded entourage didn’t retreat. The Archduke and Sophie kept driving through Sarajevo’s streets. When their driver took a wrong turn onto a street named after his uncle, Emperor Franz Joseph, the car slowed to change directions and another Serbian nationalist, Gavrilo Princip, fired his pistol into the car, fatally wounding the Archduke and his wife. Austria-Hungary blamed the Serbian government for the attack, launching World War I during July, followed by the escalating “Guns of August.” So, you could call Gavrilo Princip the “Man of the 20th Century.” Without his lucky shot, perhaps no Great War, no Hitler, no Holocaust, no Atom Bomb. But we can’t live in that dreamland. All those events followed.

Graphs are for illustrative and discussion purposes only. Please read important disclosures at the end of this commentary.
Markets were closed in America for the last five months of 1914, and for much longer in Europe, but the Dow Jones Industrials more than doubled from July 30, 1914 – when the U.S. market temporarily closed – to November 21, 1916, just after Woodrow Wilson was re-elected on a campaign of keeping American out of the Great War. The Dow had risen 110%, from 52.32 to 110.15. When America entered the war in 1917, the market trended down until the end of that year, losing 40%, but it gained back 85% from those lows by November 1919, setting a new all-time high near 120, despite the scourge of the Spanish flu.
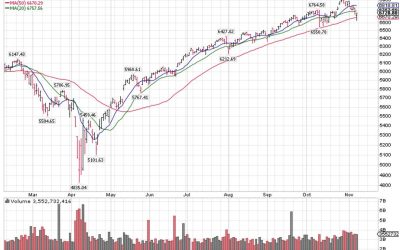
We haven’t had enough time to weigh the outcome of the Iran/Israeli war, but as Jason Bodner showed us last week, the last few instances of violent eruptions there have been positive for the market…and gold.

Graphs are for illustrative and discussion purposes only. Please read important disclosures at the end of this commentary.
Jason Bodner describes what happened next in the S&P above. Here’s how gold did: Gold was already in a major bull market in 2006, rising from $650 on July 12, 2006, to $1,000 by March 2008, but here are my calculations of how gold responded initially to the recent eruptions of violence in the Middle East:

War is indeed “hell,” as General W.T. Sherman said, but it is not the end of the world for investors.
All content above represents the opinion of Gary Alexander of Navellier & Associates, Inc.
Also In This Issue
A Look Ahead by Louis Navellier
The Fed Continues to Ignore Low Inflation – and a Weakening U.S. Economy
Income Mail by Bryan Perry
The Market Landscape Now Includes “Bunker Buster Bombs”
Growth Mail by Gary Alexander
How Do Markets React to the Outbreak of Major Wars?
Global Mail by Ivan Martchev
Should We Beware the Coming “Golden Cross”?
Sector Spotlight by Jason Bodner
Inside Our “Core Capsule,” the Market Weather is Beautiful
View Full Archive
Read Past Issues Here
About The Author

Gary Alexander
SENIOR EDITOR
Gary Alexander has been Senior Writer at Navellier since 2009. He edits Navellier’s weekly Marketmail and writes a weekly Growth Mail column, in which he uses market history to support the case for growth stocks. For the previous 20 years before joining Navellier, he was Senior Executive Editor at InvestorPlace Media (formerly Phillips Publishing), where he worked with several leading investment analysts, including Louis Navellier (since 1997), helping launch Louis Navellier’s Blue Chip Growth and Global Growth newsletters.
Prior to that, Gary edited Wealth Magazine and Gold Newsletter and wrote various investment research reports for Jefferson Financial in New Orleans in the 1980s. He began his financial newsletter career with KCI Communications in 1980, where he served as consulting editor for Personal Finance newsletter while serving as general manager of KCI’s Alexandria House book division. Before that, he covered the economics beat for news magazines. All content of “Growth Mail” represents the opinion of Gary Alexander
Important Disclosures:
Although information in these reports has been obtained from and is based upon sources that Navellier believes to be reliable, Navellier does not guarantee its accuracy and it may be incomplete or condensed. All opinions and estimates constitute Navellier’s judgment as of the date the report was created and are subject to change without notice. These reports are for informational purposes only and are not a solicitation for the purchase or sale of a security. Any decision to purchase securities mentioned in these reports must take into account existing public information on such securities or any registered prospectus.To the extent permitted by law, neither Navellier & Associates, Inc., nor any of its affiliates, agents, or service providers assumes any liability or responsibility nor owes any duty of care for any consequences of any person acting or refraining to act in reliance on the information contained in this communication or for any decision based on it.
Past performance is no indication of future results. Investment in securities involves significant risk and has the potential for partial or complete loss of funds invested. It should not be assumed that any securities recommendations made by Navellier. in the future will be profitable or equal the performance of securities made in this report. Dividend payments are not guaranteed. The amount of a dividend payment, if any, can vary over time and issuers may reduce dividends paid on securities in the event of a recession or adverse event affecting a specific industry or issuer.
None of the stock information, data, and company information presented herein constitutes a recommendation by Navellier or a solicitation to buy or sell any securities. Any specific securities identified and described do not represent all of the securities purchased, sold, or recommended for advisory clients. The holdings identified do not represent all of the securities purchased, sold, or recommended for advisory clients and the reader should not assume that investments in the securities identified and discussed were or will be profitable.
Information presented is general information that does not take into account your individual circumstances, financial situation, or needs, nor does it present a personalized recommendation to you. Individual stocks presented may not be suitable for every investor. Investment in securities involves significant risk and has the potential for partial or complete loss of funds invested. Investment in fixed income securities has the potential for the investment return and principal value of an investment to fluctuate so that an investor’s holdings, when redeemed, may be worth less than their original cost.
One cannot invest directly in an index. Index is unmanaged and index performance does not reflect deduction of fees, expenses, or taxes. Presentation of Index data does not reflect a belief by Navellier that any stock index constitutes an investment alternative to any Navellier equity strategy or is necessarily comparable to such strategies. Among the most important differences between the Indices and Navellier strategies are that the Navellier equity strategies may (1) incur material management fees, (2) concentrate its investments in relatively few stocks, industries, or sectors, (3) have significantly greater trading activity and related costs, and (4) be significantly more or less volatile than the Indices.
ETF Risk: We may invest in exchange traded funds (“ETFs”) and some of our investment strategies are generally fully invested in ETFs. Like traditional mutual funds, ETFs charge asset-based fees, but they generally do not charge initial sales charges or redemption fees and investors typically pay only customary brokerage fees to buy and sell ETF shares. The fees and costs charged by ETFs held in client accounts will not be deducted from the compensation the client pays Navellier. ETF prices can fluctuate up or down, and a client account could lose money investing in an ETF if the prices of the securities owned by the ETF go down. ETFs are subject to additional risks:
- ETF shares may trade above or below their net asset value;
- An active trading market for an ETF’s shares may not develop or be maintained;
- The value of an ETF may be more volatile than the underlying portfolio of securities the ETF is designed to track;
- The cost of owning shares of the ETF may exceed those a client would incur by directly investing in the underlying securities; and
- Trading of an ETF’s shares may be halted if the listing exchange’s officials deem it appropriate, the shares are delisted from the exchange, or the activation of market-wide “circuit breakers” (which are tied to large decreases in stock prices) halts stock trading generally.
Grader Disclosures: Investment in equity strategies involves substantial risk and has the potential for partial or complete loss of funds invested. The sample portfolio and any accompanying charts are for informational purposes only and are not to be construed as a solicitation to buy or sell any financial instrument and should not be relied upon as the sole factor in an investment making decision. As a matter of normal and important disclosures to you, as a potential investor, please consider the following: The performance presented is not based on any actual securities trading, portfolio, or accounts, and the reported performance of the A, B, C, D, and F portfolios (collectively the “model portfolios”) should be considered mere “paper” or pro forma performance results based on Navellier’s research.
Investors evaluating any of Navellier & Associates, Inc.’s, (or its affiliates’) Investment Products must not use any information presented here, including the performance figures of the model portfolios, in their evaluation of any Navellier Investment Products. Navellier Investment Products include the firm’s mutual funds and managed accounts. The model portfolios, charts, and other information presented do not represent actual funded trades and are not actual funded portfolios. There are material differences between Navellier Investment Products’ portfolios and the model portfolios, research, and performance figures presented here. The model portfolios and the research results (1) may contain stocks or ETFs that are illiquid and difficult to trade; (2) may contain stock or ETF holdings materially different from actual funded Navellier Investment Product portfolios; (3) include the reinvestment of all dividends and other earnings, estimated trading costs, commissions, or management fees; and, (4) may not reflect prices obtained in an actual funded Navellier Investment Product portfolio. For these and other reasons, the reported performances of model portfolios do not reflect the performance results of Navellier’s actually funded and traded Investment Products. In most cases, Navellier’s Investment Products have materially lower performance results than the performances of the model portfolios presented.
This report contains statements that are, or may be considered to be, forward-looking statements. All statements that are not historical facts, including statements about our beliefs or expectations, are “forward-looking statements” within the meaning of The U.S. Private Securities Litigation Reform Act of 1995. These statements may be identified by such forward-looking terminology as “expect,” “estimate,” “plan,” “intend,” “believe,” “anticipate,” “may,” “will,” “should,” “could,” “continue,” “project,” or similar statements or variations of such terms. Our forward-looking statements are based on a series of expectations, assumptions, and projections, are not guarantees of future results or performance, and involve substantial risks and uncertainty as described in Form ADV Part 2A of our filing with the Securities and Exchange Commission (SEC), which is available at www.adviserinfo.sec.gov or by requesting a copy by emailing info@navellier.com. All of our forward-looking statements are as of the date of this report only. We can give no assurance that such expectations or forward-looking statements will prove to be correct. Actual results may differ materially. You are urged to carefully consider all such factors.
FEDERAL TAX ADVICE DISCLAIMER: As required by U.S. Treasury Regulations, you are informed that, to the extent this presentation includes any federal tax advice, the presentation is not written by Navellier to be used, and cannot be used, for the purpose of avoiding federal tax penalties. Navellier does not advise on any income tax requirements or issues. Use of any information presented by Navellier is for general information only and does not represent tax advice either express or implied. You are encouraged to seek professional tax advice for income tax questions and assistance.
IMPORTANT NEWSLETTER DISCLOSURE:The hypothetical performance results for investment newsletters that are authored or edited by Louis Navellier, including Louis Navellier’s Growth Investor, Louis Navellier’s Breakthrough Stocks, Louis Navellier’s Accelerated Profits, and Louis Navellier’s Platinum Club, are not based on any actual securities trading, portfolio, or accounts, and the newsletters’ reported hypothetical performances should be considered mere “paper” or proforma hypothetical performance results and are not actual performance of real world trades. Navellier & Associates, Inc. does not have any relation to or affiliation with the owner of these newsletters. There are material differences between Navellier Investment Products’ portfolios and the InvestorPlace Media, LLC newsletter portfolios authored by Louis Navellier. The InvestorPlace Media, LLC newsletters contain hypothetical performance that do not include transaction costs, advisory fees, or other fees a client might incur if actual investments and trades were being made by an investor. As a result, newsletter performance should not be used to evaluate Navellier Investment services which are separate and different from the newsletters. The owner of the newsletters is InvestorPlace Media, LLC and any questions concerning the newsletters, including any newsletter advertising or hypothetical Newsletter performance claims, (which are calculated solely by Investor Place Media and not Navellier) should be referred to InvestorPlace Media, LLC at (800) 718-8289.
Please note that Navellier & Associates and the Navellier Private Client Group are managed completely independent of the newsletters owned and published by InvestorPlace Media, LLC and written and edited by Louis Navellier, and investment performance of the newsletters should in no way be considered indicative of potential future investment performance for any Navellier & Associates separately managed account portfolio. Potential investors should consult with their financial advisor before investing in any Navellier Investment Product.
Navellier claims compliance with Global Investment Performance Standards (GIPS). To receive a complete list and descriptions of Navellier’s composites and/or a presentation that adheres to the GIPS standards, please contact Navellier or click here. It should not be assumed that any securities recommendations made by Navellier & Associates, Inc. in the future will be profitable or equal the performance of securities made in this report.
FactSet Disclosure: Navellier does not independently calculate the statistical information included in the attached report. The calculation and the information are provided by FactSet, a company not related to Navellier. Although information contained in the report has been obtained from FactSet and is based on sources Navellier believes to be reliable, Navellier does not guarantee its accuracy, and it may be incomplete or condensed. The report and the related FactSet sourced information are provided on an “as is” basis. The user assumes the entire risk of any use made of this information. Investors should consider the report as only a single factor in making their investment decision. The report is for informational purposes only and is not intended as an offer or solicitation for the purchase or sale of a security. FactSet sourced information is the exclusive property of FactSet. Without prior written permission of FactSet, this information may not be reproduced, disseminated or used to create any financial products. All indices are unmanaged and performance of the indices include reinvestment of dividends and interest income, unless otherwise noted, are not illustrative of any particular investment and an investment cannot be made in any index. Past performance is no guarantee of future results.
The post 6-24-25: How Do Markets React to the Outbreak of Major Wars? appeared first on Navellier.