by Jason Bodner
June 3, 2025
Imagine what life was like thousands of years ago. The usual depiction is struggle; visceral survival ruled prehistoric life. But I also imagine how wonderfully quiet things were. No cars, trucks, trains or planes shattering bird-songs. No phones buzzing, TVs blaring, or city sounds. Even in my suburban community, I can’t enjoy the peace of a neighborhood walk without hearing leaf-blowers, cars, or saws and hammers.
Life must have been sweetly quiet then. That left loads of time to think, and just “be,” a state of mind considered to be a luxury today. Noise pollution can cause serious disruptions. Plenty of scientific studies show how harmful noise can be. Studies have shown that consistent loud noise exposure can affect child development, increase blood pressure, cause memory loss and reading impairment, and damage hearing.
Yet we live with an ever-growing level of noise in our lives.
The investing world is no different. There are countless distractions that I feel are harmful to an investor achieving common objectives – to grow our portfolios in order to make a comfortable amount of money.
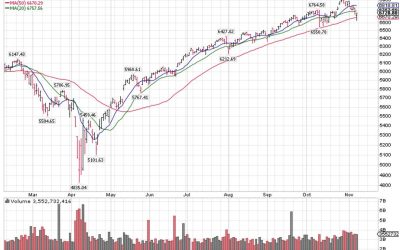
Let’s look at a simple example. Here is a daily chart of the S&P 500 from the start 2023 through May 29th, 2025 – a little under two-and-a-half years:

Graphs are for illustrative and discussion purposes only. Please read important disclosures at the end of this commentary.
That’s a nice uptrend, but there were some significant drops along the way, which caused a lot of pain and anxiety at the time. The most recent, of course, was the market’s reaction to Trump’s tariffs in April.
Now let’s look at the same exact chart, only I switched the periodicity from daily to quarterly:

Graphs are for illustrative and discussion purposes only. Please read important disclosures at the end of this commentary.
Had you tuned out all the investing world’s noise from January 1, 2023, to today, and opened your portfolio totals at the end of May 2025, you’d be staring at an eye-popping 54% gain.
Had we looked only at full years, the S&P registered a 23% gain in 2023 and a 24% gain in 2024. Admittedly, we’ve only seen a 0.5% gain in five-months of 2025, but the year has seven-months to go.
Taking it further, let’s look at 35-years of market returns. On the left is daily, while the right is yearly:

Graphs are for illustrative and discussion purposes only. Please read important disclosures at the end of this commentary.
Unfortunately, “tuning out the noise” isn’t profitable for the investing professional. That includes brokers, advisors and the media. The first two often get paid per transaction, and the media get paid by advertisers, so the industry wants you to tune into every last dramatic detail of every possible reason to “act now.”
I find that filtering out that noise helps create a calm uncluttered head. For instance, after the S&P 500 peaked on February 19th, it plummeted – due mostly to a dose of bad news – until its April 8th low.
The scene was harrowing and probably boosted sales of Tums, so let’s “de-noise’ that 7-week stretch.
Starting February 21st, there was a steady stream of outflows with few interruptions until their zenith on April 8th. It turns out that during those 33 trading days, there were 6,973-outflow signals and 1,341-inflows. Put another way, for those 33-days, only 16.1% of all signals were inflows:

Graphs are for illustrative and discussion purposes only. Please read important disclosures at the end of this commentary.
I looked back 35-years, since 1990, to see other periods of history that were similar in terms of scale of outflows. Unsurprisingly, these nerve-racking times included the dot.com bubble, 9/11, The Great Financial Crisis and COVID. What happened after these pain points? The forward returns were positive:

Now if we just look at the last 15-years of data, excluding all the crises prior to 2010, returns are significantly stronger, with a perfect record nine-months on, and later:

Graphs are for illustrative and discussion purposes only. Please read important disclosures at the end of this commentary.
This helps weed out the noise of the recent volatility. Better yet, it helps us navigate the daily din of Trump’s tweets, or Wall Street’s endless “wall of worry.”
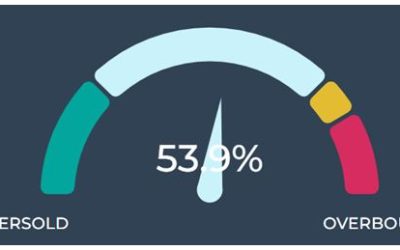
Turning to what is happening now, we can see that money is flowing into stocks again. The Big Money Index (BMI) continues its rise from April low of 35.4%. The latest reading of 73.1% indicates that 73% of all signals have been inflows for the past 25-trading days.

Graphs are for illustrative and discussion purposes only. Please read important disclosures at the end of this commentary.
The BMI alone can sometimes be misleading, as it is a ratio: Nine inflows and one outflow yields 90%, just as 900-inflows and 100-outflows is 90%. That is why we like to see a healthy number of inflows.

Graphs are for illustrative and discussion purposes only. Please read important disclosures at the end of this commentary.
Looking at these inflows another way, we compare the same chart above from February to April lows to May 12th (when Trump delayed tariffs) to now. We see a flip from 16% inflows to 83% inflows:

Graphs are for illustrative and discussion purposes only. Please read important disclosures at the end of this commentary.
I’ve mentioned this before, but where the money is flowing matters. We can see this below, through the 11 S&P sector rankings, that the traditional growth sectors, like Technology and Discretionary, are rising in rank while defensive sectors like Staples and Real Estate (yield) are falling:

Graphs are for illustrative and discussion purposes only. Please read important disclosures at the end of this commentary.
This is important, as accepting risk by switching to growth is bullish. Again – looking at the numbers of inflows matters, too. We can see elevated inflows in Industrials, Financials, Technology, and Discretionary:


Graphs are for illustrative and discussion purposes only. Please read important disclosures at the end of this commentary.
Risk is moving back into equities. It may not be at a rapid pace, but it is visible. Add to this the fact that earnings are working. As of May 23rd, with 96% of the S&P 500 reporting earnings, 78% of companies beat earnings estimates and 63% beat sales estimates. The Q1 blended year-over-year earnings growth rate is 12.9%. That marks the second-straight quarter of double-digit earnings growth for the index.
The P/E ratio continues to grind higher, which continues to demonstrate that perhaps elevated P/E ratios are not the most reliable indicator of value. Look that the chart over the last 10-years:

Graphs are for illustrative and discussion purposes only. Please read important disclosures at the end of this commentary.
Long-term, inflows of funds drive markets higher. We see more inflows than outflows now. The 34-½-year track record is that 62.3% of all signals are inflows.
When we strip out the noise, the market is right where it needs to be.
So, just shut out the noise. Turn up the quiet.
Winston Churchill went for a walk to escape the huge pressure leading up to the German blitz in 1940. Passing a whistling newsboy he snapped: “Stop that whistling!”
“Why should I?”
“Because I don’t like it, and it’s a horrible noise.”
“Well, you can shut your ears, can’t you?”
Yes, you can.
All content above represents the opinion of Jason Bodner of Navellier & Associates, Inc.
Also In This Issue
A Look Ahead by Louis Navellier
The EU Now Seems to be Fighting for Its Long-Term Existence
Income Mail by Bryan Perry
“Trumpenomics” is Finally Kicking In
Growth Mail by Gary Alexander
Rising Debts Limit America’s Growth Potential
Global Mail by Ivan Martchev
More Trillion Dollar Swings
Sector Spotlight by Jason Bodner
Turn Up the Quiet
View Full Archive
Read Past Issues Here

Jason Bodner
MARKETMAIL EDITOR FOR SECTOR SPOTLIGHT
Jason Bodner writes Sector Spotlight in the weekly Marketmail publication and has authored several white papers for the company. He is also Co-Founder of Macro Analytics for Professionals which produces proprietary equity accumulation and distribution research for its clients. Previously, Mr. Bodner served as Director of European Equity Derivatives for Cantor Fitzgerald Europe in London, then moved to the role of Head of Equity Derivatives North America for the same company in New York. He also served as S.V.P. Equity Derivatives for Jefferies, LLC. He received a B.S. in business administration in 1996, with honors, from Skidmore College as a member of the Periclean Honors Society. All content of “Sector Spotlight” represents the opinion of Jason Bodner
Important Disclosures:
Jason Bodner is a co-founder and co-owner of Mapsignals. Mr. Bodner is an independent contractor who is occasionally hired by Navellier & Associates to write an article and or provide opinions for possible use in articles that appear in Navellier & Associates weekly Market Mail. Mr. Bodner is not employed or affiliated with Louis Navellier, Navellier & Associates, Inc., or any other Navellier owned entity. The opinions and statements made here are those of Mr. Bodner and not necessarily those of any other persons or entities. This is not an endorsement, or solicitation or testimonial or investment advice regarding the BMI Index or any statements or recommendations or analysis in the article or the BMI Index or Mapsignals or its products or strategies.
Although information in these reports has been obtained from and is based upon sources that Navellier believes to be reliable, Navellier does not guarantee its accuracy and it may be incomplete or condensed. All opinions and estimates constitute Navellier’s judgment as of the date the report was created and are subject to change without notice. These reports are for informational purposes only and are not a solicitation for the purchase or sale of a security. Any decision to purchase securities mentioned in these reports must take into account existing public information on such securities or any registered prospectus.To the extent permitted by law, neither Navellier & Associates, Inc., nor any of its affiliates, agents, or service providers assumes any liability or responsibility nor owes any duty of care for any consequences of any person acting or refraining to act in reliance on the information contained in this communication or for any decision based on it.
Past performance is no indication of future results. Investment in securities involves significant risk and has the potential for partial or complete loss of funds invested. It should not be assumed that any securities recommendations made by Navellier. in the future will be profitable or equal the performance of securities made in this report. Dividend payments are not guaranteed. The amount of a dividend payment, if any, can vary over time and issuers may reduce dividends paid on securities in the event of a recession or adverse event affecting a specific industry or issuer.
None of the stock information, data, and company information presented herein constitutes a recommendation by Navellier or a solicitation to buy or sell any securities. Any specific securities identified and described do not represent all of the securities purchased, sold, or recommended for advisory clients. The holdings identified do not represent all of the securities purchased, sold, or recommended for advisory clients and the reader should not assume that investments in the securities identified and discussed were or will be profitable.
Information presented is general information that does not take into account your individual circumstances, financial situation, or needs, nor does it present a personalized recommendation to you. Individual stocks presented may not be suitable for every investor. Investment in securities involves significant risk and has the potential for partial or complete loss of funds invested. Investment in fixed income securities has the potential for the investment return and principal value of an investment to fluctuate so that an investor’s holdings, when redeemed, may be worth less than their original cost.
One cannot invest directly in an index. Index is unmanaged and index performance does not reflect deduction of fees, expenses, or taxes. Presentation of Index data does not reflect a belief by Navellier that any stock index constitutes an investment alternative to any Navellier equity strategy or is necessarily comparable to such strategies. Among the most important differences between the Indices and Navellier strategies are that the Navellier equity strategies may (1) incur material management fees, (2) concentrate its investments in relatively few stocks, industries, or sectors, (3) have significantly greater trading activity and related costs, and (4) be significantly more or less volatile than the Indices.
ETF Risk: We may invest in exchange traded funds (“ETFs”) and some of our investment strategies are generally fully invested in ETFs. Like traditional mutual funds, ETFs charge asset-based fees, but they generally do not charge initial sales charges or redemption fees and investors typically pay only customary brokerage fees to buy and sell ETF shares. The fees and costs charged by ETFs held in client accounts will not be deducted from the compensation the client pays Navellier. ETF prices can fluctuate up or down, and a client account could lose money investing in an ETF if the prices of the securities owned by the ETF go down. ETFs are subject to additional risks:
- ETF shares may trade above or below their net asset value;
- An active trading market for an ETF’s shares may not develop or be maintained;
- The value of an ETF may be more volatile than the underlying portfolio of securities the ETF is designed to track;
- The cost of owning shares of the ETF may exceed those a client would incur by directly investing in the underlying securities and;
- Trading of an ETF’s shares may be halted if the listing exchange’s officials deem it appropriate, the shares are delisted from the exchange, or the activation of market-wide “circuit breakers” (which are tied to large decreases in stock prices) halts stock trading generally.
Grader Disclosures: Investment in equity strategies involves substantial risk and has the potential for partial or complete loss of funds invested. The sample portfolio and any accompanying charts are for informational purposes only and are not to be construed as a solicitation to buy or sell any financial instrument and should not be relied upon as the sole factor in an investment making decision. As a matter of normal and important disclosures to you, as a potential investor, please consider the following: The performance presented is not based on any actual securities trading, portfolio, or accounts, and the reported performance of the A, B, C, D, and F portfolios (collectively the “model portfolios”) should be considered mere “paper” or pro forma performance results based on Navellier’s research.
Investors evaluating any of Navellier & Associates, Inc.’s, (or its affiliates’) Investment Products must not use any information presented here, including the performance figures of the model portfolios, in their evaluation of any Navellier Investment Products. Navellier Investment Products include the firm’s mutual funds and managed accounts. The model portfolios, charts, and other information presented do not represent actual funded trades and are not actual funded portfolios. There are material differences between Navellier Investment Products’ portfolios and the model portfolios, research, and performance figures presented here. The model portfolios and the research results (1) may contain stocks or ETFs that are illiquid and difficult to trade; (2) may contain stock or ETF holdings materially different from actual funded Navellier Investment Product portfolios; (3) include the reinvestment of all dividends and other earnings, estimated trading costs, commissions, or management fees; and, (4) may not reflect prices obtained in an actual funded Navellier Investment Product portfolio. For these and other reasons, the reported performances of model portfolios do not reflect the performance results of Navellier’s actually funded and traded Investment Products. In most cases, Navellier’s Investment Products have materially lower performance results than the performances of the model portfolios presented.
This report contains statements that are, or may be considered to be, forward-looking statements. All statements that are not historical facts, including statements about our beliefs or expectations, are “forward-looking statements” within the meaning of The U.S. Private Securities Litigation Reform Act of 1995. These statements may be identified by such forward-looking terminology as “expect,” “estimate,” “plan,” “intend,” “believe,” “anticipate,” “may,” “will,” “should,” “could,” “continue,” “project,” or similar statements or variations of such terms. Our forward-looking statements are based on a series of expectations, assumptions, and projections, are not guarantees of future results or performance, and involve substantial risks and uncertainty as described in Form ADV Part 2A of our filing with the Securities and Exchange Commission (SEC), which is available at www.adviserinfo.sec.gov or by requesting a copy by emailing info@navellier.com. All of our forward-looking statements are as of the date of this report only. We can give no assurance that such expectations or forward-looking statements will prove to be correct. Actual results may differ materially. You are urged to carefully consider all such factors.
FEDERAL TAX ADVICE DISCLAIMER: As required by U.S. Treasury Regulations, you are informed that, to the extent this presentation includes any federal tax advice, the presentation is not written by Navellier to be used, and cannot be used, for the purpose of avoiding federal tax penalties. Navellier does not advise on any income tax requirements or issues. Use of any information presented by Navellier is for general information only and does not represent tax advice either express or implied. You are encouraged to seek professional tax advice for income tax questions and assistance.
IMPORTANT NEWSLETTER DISCLOSURE:The hypothetical performance results for investment newsletters that are authored or edited by Louis Navellier, including Louis Navellier’s Growth Investor, Louis Navellier’s Breakthrough Stocks, Louis Navellier’s Accelerated Profits, and Louis Navellier’s Platinum Club, are not based on any actual securities trading, portfolio, or accounts, and the newsletters’ reported hypothetical performances should be considered mere “paper” or proforma hypothetical performance results and are not actual performance of real world trades. Navellier & Associates, Inc. does not have any relation to or affiliation with the owner of these newsletters. There are material differences between Navellier Investment Products’ portfolios and the InvestorPlace Media, LLC newsletter portfolios authored by Louis Navellier. The InvestorPlace Media, LLC newsletters contain hypothetical performance that do not include transaction costs, advisory fees, or other fees a client might incur if actual investments and trades were being made by an investor. As a result, newsletter performance should not be used to evaluate Navellier Investment services which are separate and different from the newsletters. The owner of the newsletters is InvestorPlace Media, LLC and any questions concerning the newsletters, including any newsletter advertising or hypothetical Newsletter performance claims, (which are calculated solely by Investor Place Media and not Navellier) should be referred to InvestorPlace Media, LLC at (800) 718-8289.
Please note that Navellier & Associates and the Navellier Private Client Group are managed completely independent of the newsletters owned and published by InvestorPlace Media, LLC and written and edited by Louis Navellier, and investment performance of the newsletters should in no way be considered indicative of potential future investment performance for any Navellier & Associates separately managed account portfolio. Potential investors should consult with their financial advisor before investing in any Navellier Investment Product.
Navellier claims compliance with Global Investment Performance Standards (GIPS). To receive a complete list and descriptions of Navellier’s composites and/or a presentation that adheres to the GIPS standards, please contact Navellier or click here. It should not be assumed that any securities recommendations made by Navellier & Associates, Inc. in the future will be profitable or equal the performance of securities made in this report.
FactSet Disclosure: Navellier does not independently calculate the statistical information included in the attached report. The calculation and the information are provided by FactSet, a company not related to Navellier. Although information contained in the report has been obtained from FactSet and is based on sources Navellier believes to be reliable, Navellier does not guarantee its accuracy, and it may be incomplete or condensed. The report and the related FactSet sourced information are provided on an “as is” basis. The user assumes the entire risk of any use made of this information. Investors should consider the report as only a single factor in making their investment decision. The report is for informational purposes only and is not intended as an offer or solicitation for the purchase or sale of a security. FactSet sourced information is the exclusive property of FactSet. Without prior written permission of FactSet, this information may not be reproduced, disseminated or used to create any financial products. All indices are unmanaged and performance of the indices include reinvestment of dividends and interest income, unless otherwise noted, are not illustrative of any particular investment and an investment cannot be made in any index. Past performance is no guarantee of future results.
The post 6-3-25: Turn Up the Quiet appeared first on Navellier.