by Gary Alexander
March 18, 2025
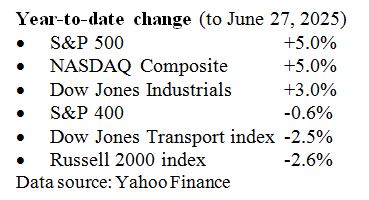
The week of March 16-20, 2020, brought us the COVID lock-down five years ago. The Fed began the week with an emergency Sunday night meeting and a full 1% rate cut, but that didn’t keep the Dow from falling 3,000 points (-13%) on Monday, March 16, with record-high volatility (an 82.69 VIX reading), as state after state announced lock-downs. The S&P fell 35% from February 19 to March 23 – dates that are eerily familiar to this year, when the S&P peaked on February 19th and was off over 10% by March 13th.
In both 2020 and 2025, President’s Day fell on February 17, and the S&P 500 peaked two days later:
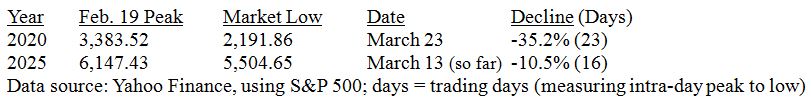
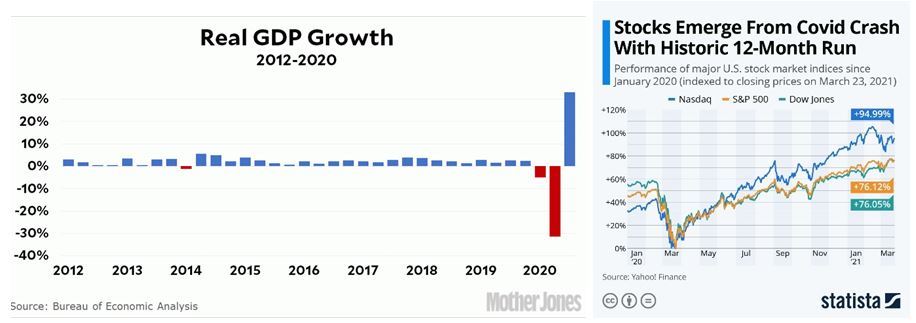
More lows are likely to come this March, but the untold COVID story is that the March market panic only lasted 23 trading days (33 calendar days), and the recovery was extremely V-shaped, with a 20% rise in just three DAYS, March 23-26, reaching old highs by August. GDP also bounced back in ultra-V-shape:
Graphs are for illustrative and discussion purposes only. Please read important disclosures at the end of this commentary.
COVID was real, and it impacted the whole world. In America, according to the U.S. Bureau of Labor Statistics, non-farm payroll employment in the United States declined by 9.4 million in 2020, the largest calendar-year decline in history, most of it due to forced closing of up to 40% of small businesses in the second quarter, of which 30% remained partly closed for most of the year. Despite that, our GDP and stock market soared in the second half of 2020. But now, the press is ginning up COVID-level panic over a few tit-for-tat trade tiffs and a few thousand job cuts in Washington, DC. It makes you wonder if the most contagious disease isn’t carried through breath or touch but through the press and internet panics.
The press drumbeat has been brutal during this correction. Even the staid Wall Street Journal joined this negative chorus on March 10 with this headline: “The Mounting Case Against U.S. Stocks: Worries about a trade war, signs of flagging growth and splinters in the AI trade are pressuring U.S. shares.” Sure enough, the next day, the Journal’s headline was “NASDAQ Has Worst Day Since 2022,” down 4%. Also on Tuesday came this lead Journal editorial: “Will There be a Trump Recession?” and an Op-Ed: “The Trade War Pounds Stocks,” by Greg Jensen, co-chief investment officer at Bridgewater Associates.
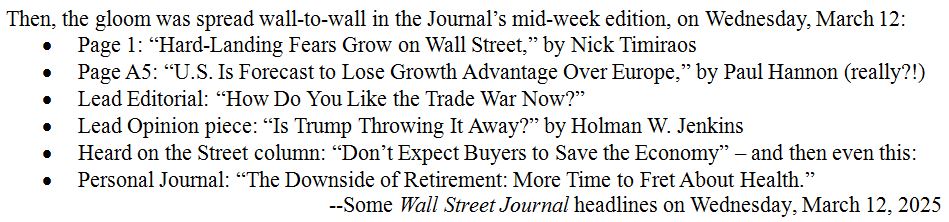
So, we are to believe that consumers will not spend, the U.S. will go the way of Europe – or worse, be eclipsed by the slowest-growing continent on earth – and Trump killed global growth in just six weeks.
Fortunately, I just finished reading Nate Silver’s 2012 book, “The Signal and the Noise,” which highlights the fact that most of us get hooked on the daily noise that assaults us, mostly on TV cable talk shows, on the internet and on our increasingly stupid “smart” phones that memorize our biases and then feed them.
Ed Yardeni wrote in last Monday Morning’s briefing that “The economy’s noise-to-signal ratio (NTSR) has been rising rapidly in recent weeks. As a result, it has gotten harder to get a read on the economy lately. Washington’s rapidly increasing NTSR is also troubling.” He then referred to a previous Briefing (March 5th), titled “Trump Turmoil Raises Odds of a Recession,” about Trump tweets that torpedo stocks.
President Trump doesn’t put much of a guard rail on what he says, or how he impacts the market, so he can push stocks down a lot faster than previous presidents, but investors must also share the blame by being so easily manipulated – and impatient. When it comes to tariffs, the world’s trade system has needed rebalancing for a long time, at least since 1990, when the Cold War ended, but no recent president has addressed the problem. President Trump has stirred the pot and won’t rest until tariffs and trading fees are much lower across the board. Then we will all prosper. Investors can’t see that yet, so they panicked.
Likewise, the national debt has needed addressing for the 24 years since the last balanced budget in 2001, but none of the last four presidents (two of each party) or 12 Congresses (also evenly balanced) have even begun to address cost cutting, so Trump and Musk jumped into the problem over-eagerly and the market is thrown into an added panic over a few thousand jobs lost, or redundant departments being closed.
This is short-sighted thinking by most pundits and investors, in my view, and this is why I read more history than daily news, and why I anticipate recoveries more than fearing recessions. Even if we have a short recession, so what? We had a humdinger of a recession five years ago, in the first half of 2020, but then we saw a soaring second half of 2020 and strong market gains over the last five years as well.
In Nate Silver’s book – as well as those by two great market analysts, Ed Yardeni, and Louis Navellier, in their books profiled below – we see the benefit of authors who experienced many up and down markets so they can separate true market signals from the noise. Ed Yardeni’s “Predicting the Markets” traces his career from his economic studies at Yale through his early Wall Street experiences to hanging out his own shingle. He includes an especially valuable survey of the meaning behind most key economic indicators.
Louis Navellier follows the same basic template of sharing his early background in computer crunching data at Cal State and the Federal Reserve, then sharing his findings in award-winning newsletters, testing a wide variety of market variables to discover the secret of finding market-beating stocks with low risk.

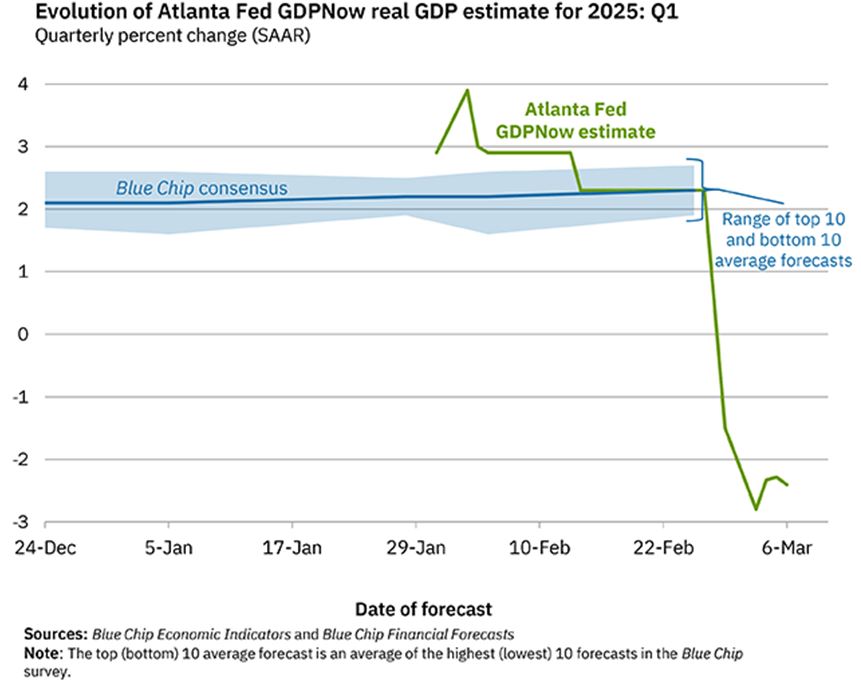
Even the Atlanta Fed’s GDPNow Model Has Broken Its Gears in a Panic Attack
During our longest bull market in history, from 2009 through 2020, economist Ed Yardeni counted 66 market “panic attacks” like we’re seeing now, many of which led to 10% or greater market corrections. That’s an average of one false panic every two months, the very definition of “noise” over knowledge.
And now, even the Atlanta Fed’s GDPNow model has panicked, blowing its gears with a record 5% GDP swing in their first-quarter GDP forecast in just five days. On Wednesday, February 26, their GDP model forecast a +2.3% gain. On Monday, March 3rd, just three business days later, their model forecast a -2.8% decline. An ocean liner can’t make a 180-degree turn within half a mile, and an economy can’t go from +2.3% to -2.8% for the same quarter within five days. The Atlanta team explained that the huge swan dive came from “a big jump in January imports,” led by a jump in gold imports on Friday, February 28. On the same Friday, January’s personal consumption declined 0.5%, but that explanation only reveals a flawed model. It takes human beings to interpret data so they won’t be jerked around by figures that can be easily explained by: (1) exporters dumping their goods before tariffs take effect, and (2) fires and bad weather.
Graphs are for illustrative and discussion purposes only. Please read important disclosures at the end of this commentary.
As for the surging gold imports – which rose from $13.2 billion in December to $32.6 billion in January –economists at the Atlanta Fed said that single data point accounted for about two percentage points in their 5-point downward revision, but that is a one-time technical problem within the London Bullion Market Association after Trump’s victory, anticipating more demand in gold in America in the Trump era, not a big factor in our GDP, but it accounted for nearly 60% of the widening of the goods trade deficit.
Once again, it’s time for some realism and historical perspective in our national economic reporting. A good place to start is in the three books pictured above, by three seasoned, market observers.
The post 3-18-25: Beware the Ides of March … What? Again? appeared first on Navellier.