by Gary Alexander
February 19, 2025
President’s Day this year (Monday, February 17) marked the midpoint between Lincoln’s birthday (February 12) and Washington’s birthday (February 22). When I was in school, those birthday holidays were celebrated separately, on their exact dates, but since 1968, the two have been combined by the “Uniform Monday Holiday Act” to be the third Monday in February, renamed President’s Day.
Expanding beyond those two giants, if I were to name our four most consequential Presidents, they were all born in “Greater February,” adding Franklin Roosevelt’s natal day, January 30 (1882), plus Ronald Reagan (February 6, 1911) as our four top candidates for a winter-born Mount Rushmore. One more could be an asterisk – our shortest-running leader, William Henry Harrison, born February 9, 1773. He gave a two-hour Inauguration talk, sans coat, in freezing weather and died a month into his 1841 term.
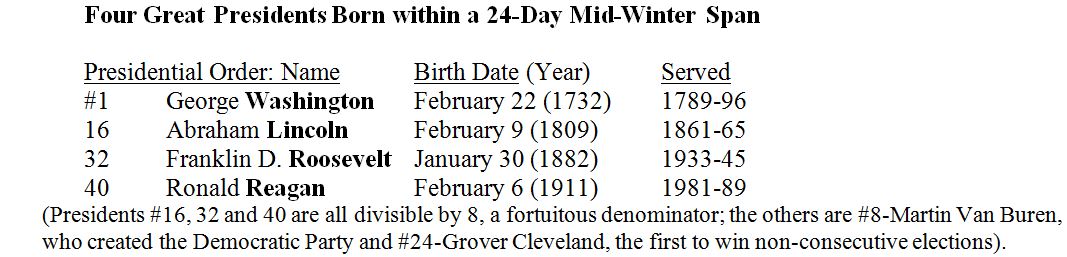
President Washington’s greatest act was perhaps to resign to his farm and not become King George. He was also elected unanimously and refused to start (or join) a political party. Then came the partisan wars, first Adams vs. Jefferson, then the Whigs (like Harrison), and (since 1856) Republicans vs. Democrats.
Presidents #7-Andrew Jackson and #8-Martin Van Buren ran the first Democratic National Convention in 1832, making the Democrats the oldest political party in the world. The Republican Party, founded in 1854, is now #3. (Britain’s Conservative Party, the Tories, are now second oldest, founded in 1834).
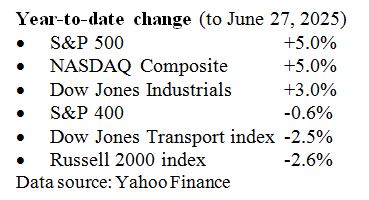
Turning to the stock market, pundits have long argued about whether the Republicans (who dominated the White House from 1860 to 1932) are better for business than the Democrats (who dominated from 1932 to 1980, and recently.) There are several charts that show stock markets performing better under Democratic leaders – ignoring the composition of Congress. I have long argued, and shown through charts, that “gridlock” (one party controlling Congress, the other controlling the White House) is the best mix for market performance, because it provides checks and balances against too much federal mischief.
However, I will pull back somewhat from that easy generalization now, since there are too many other variables, one of them being Jason Bodner’s recent research into the widely variable volatility under various presidencies since Clinton. Considering the tech stock bubbles, the Great Recession, COVID and other crises, one’s market returns depend greatly on entry and exit points, and an investor’s willingness to ride these massive waves up and down. In addition, the times and dates for measuring presidencies come into question: Do you measure from: (1) election day, (2) the start of calendar years, (3) inauguration day, or (4) long before election day, when markets tend to anticipate the next president’s victory in advance?
So, here are a few caveats for measuring presidencies, parties, and market performance during their terms:
- VOLATILITY is a big deal, as Jason Bodner shows in his columns here.
- The content of CONGRESS is a big deal, for instance in the Clinton years.
- How much the President cooperates with Congress makes a big difference.
- You also must account for inflation, which most charts don’t do.
- It’s probably better to measure from election-day than Inauguration Day.
- Also, Markets ANTICIPATE Presidential wins, in many cases, months in advance.
So, all the historical charts of performances of markets based on Presidents by parties are basically either woefully incomplete or worthless. It’s far better, in my view, to look at the policies passed in their years:
To measure presidential performance more accurately:
- Examine the Economic POLICIES passed by that President and Congress together (for instance Clinton and the Gingrich Republicans passed capital gains tax cuts and balanced budgets, 1997-2001)
- Adjust all returns for inflation and volatility.
Example #1: Higher Revenues Came from Trump Tax Cuts – Under Biden
The Trump Tax Cuts passed in late 2017 and took effect in 2018. Trump’s final “normal” fiscal year was 2019, before COVID changed our world. Since President Biden did not repeal or change the Trump tax cuts, we now have what amounts to six years of prosperity under Trump’s tax cuts interrupted by one year of Covid shutdowns in 2020. Who gets credits for rising tax revenues and stock prices, Biden or Trump?
Since 2019, revenues are way up, +42% since 2019, but federal spending is up more, 52% in those same five years, with the five-year cumulative deficits reaching $10.8 trillion, averaging $2.16 trillion per year.

Examples 2 & 3: Democrats (Like Kennedy/Johnson and Clinton) Cut Taxes, Too
In “Taxes Have Consequences: An Income Tax History of the United States” (2022), Art Laffer and two other PhD economists (Jeanne Carnes Sinquefield and Brian Domatrovic) focused on the 110 years since the birth of the Fed and income taxes in 1913. Here are two of their examples of Democratic tax cuts:
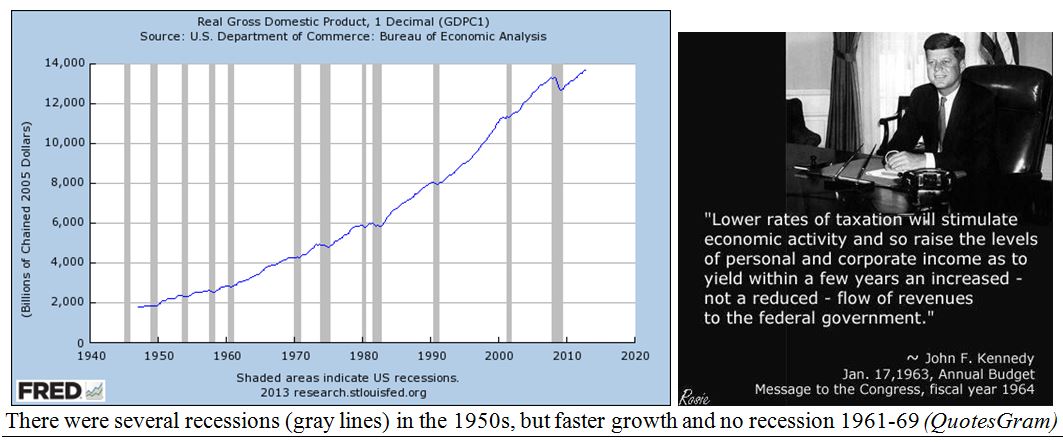
1960s: Kennedy-Johnson: From 1952 to 1963, the top income tax rate was over 90%, resulting in slow growth under President Eisenhower, including three recessions, but Democratic President John Kennedy proposed a cut in top tax rates from 91% to 70% plus a cut in corporate taxes and trade tariffs. He was assassinated before his ideas passed, but Lyndon Johnson passed the “Kennedy-Johnson tax cuts,” and the nation prospered for the rest of the 1960s, with the longest, strongest postwar recovery to that date.
Graphs are for illustrative and discussion purposes only. Please read important disclosures at the end of this commentary.
1997-2001: When the Republicans took over Congress for the first time in 40 years (in 1994), President Bill Clinton changed his policy directives. He made dramatic statements such as “the era of big government is over” and “this is the end of welfare as we know it.” He also cut capital gains taxes from 28% to 20% at the start of his second term, creating a growth spurt, not to mention five straight years of 20% or greater growth in the S&P 500, from 1995 to 1999. The end result was four straight balanced budgets in the federal fiscal years 1998 through 2001, before debt returned with a vengeance since 2001.
So, the first order of business in Trump’s first 100 days is the extension of his 2017 tax cuts, a proven President’s Day formula for generating more revenue as well as more prosperity during the Roaring ‘20s.
The post 2-19-25: A President’s Day Formula for Soaring Tax Revenues! appeared first on Navellier.