by Jason Bodner
November 19, 2024
“It’s the most wonderful time of the year.”
– Andy Williams’ hit Christmas song from December 1962
“It’s a good time for stocks.”
That’s what I said at a lunch meeting last Thursday, as the market was correcting. Some things in life are obvious. For instance, a giraffe is 30 times more likely to get hit by lightning than a human, being so tall. Or here’s another one: Wearing a necktie can reduce the flow of blood to a fellow’s brain by 7.5%.
Politicians seem to wear a lot of ties… no comment.
November 5th’s red sweep politically certainly elicited a huge chorus of both cheers and jeers. But I’m not into politics. I am into investing. And as an investor, there is plenty to cheer about. The “Trump 2.0 Trade” arrived on cue, and it exploded, but many wonder now, however, if it’s already over.
I have heard no shortage of pundits and pontificators saying the correction will come, if it hasn’t already started. And sure enough, stocks have seen a couple of sloppy days. It is enough to shake confidence.
Those who regularly read my column know that I don’t fall for emotional doubt and anxiety. I prefer cold hard data to guide me in market analysis, so today I will present some evidence that should make you want to get up and dance regardless of who you voted for.
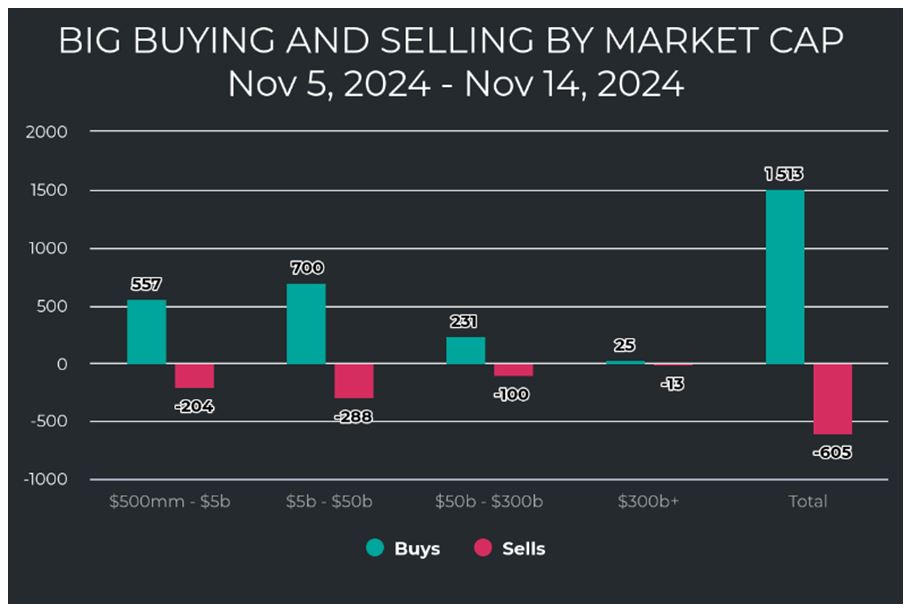
First let’s go over the state of the market. Since election day, unusually large buying has exploded. Below we see the buying distributed by market cap (size). You can see two things clearly:
- There was huge buying – 1,562 unusually large buys to be exact (including ETFs). That works out to 195 large buys per day. The 10-year average daily large buy is 64, and the 34-year average since 1990 is 50. So, since the election buying has been almost four times the multi-decade average.
- When looking at the chart below, we see that 83% of all unusual buying took place in small and mid-sized companies – those with $50 billion market cap and below:
Graphs are for illustrative and discussion purposes only. Please read important disclosures at the end of this commentary.
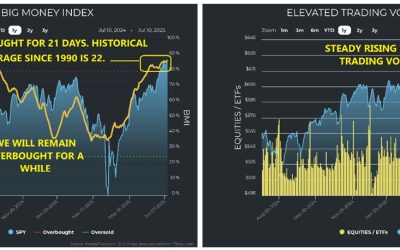
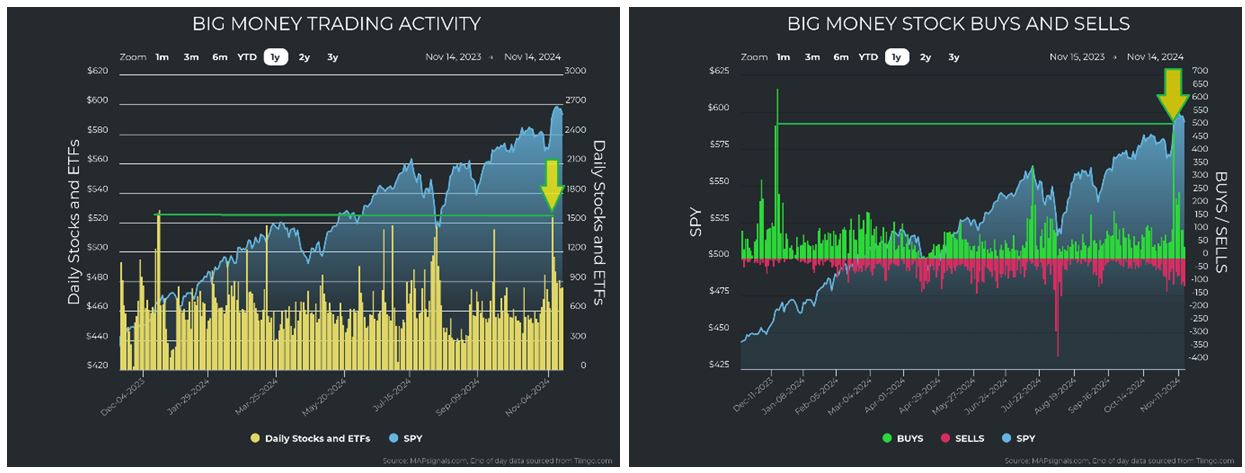
Next, let’s have a look at trading volumes and how buying shakes out versus the last year.
In the chart on the left, we see that the unusually large trading volumes the day after the election were the highest since last December. The same goes for unusual buys – they were off the charts:
Graphs are for illustrative and discussion purposes only. Please read important disclosures at the end of this commentary.
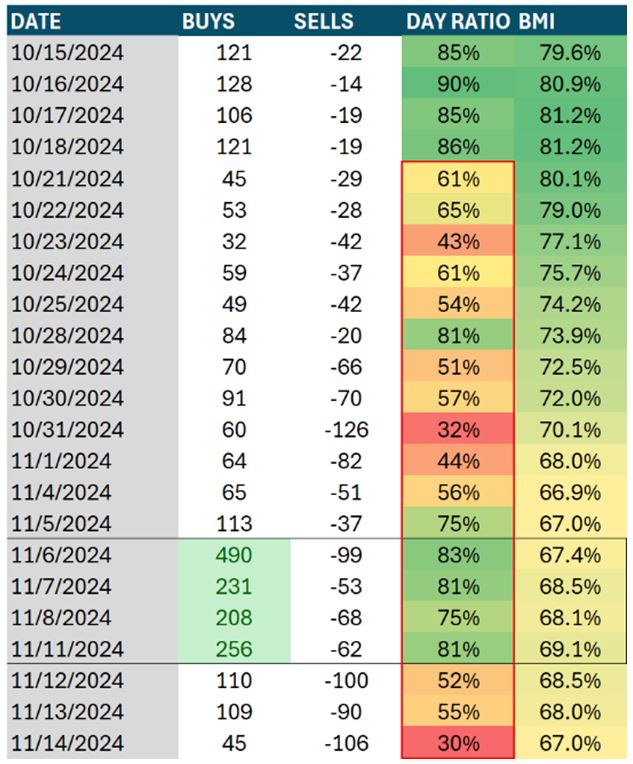
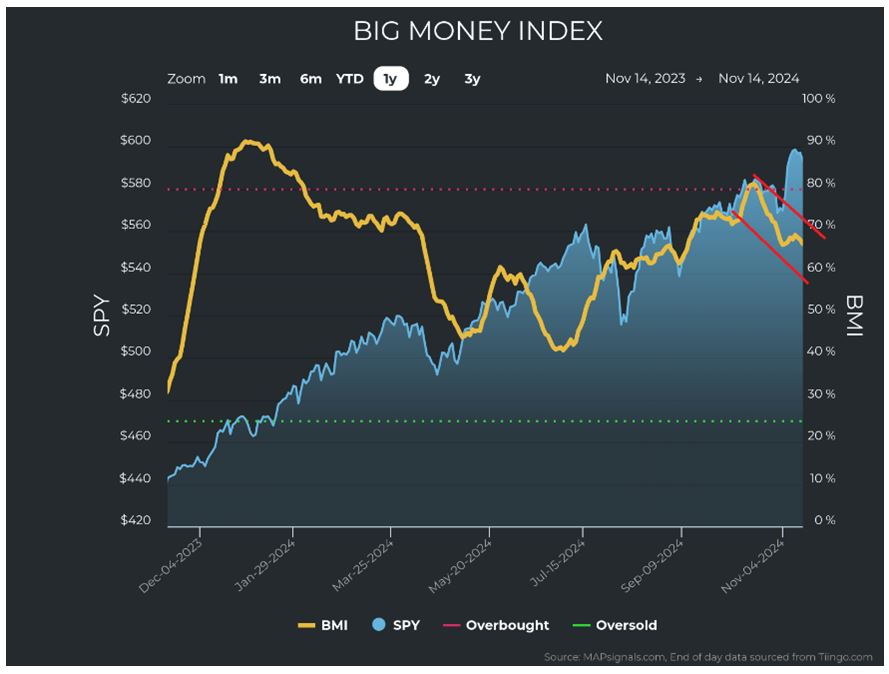
This might cause you to think that the Big Money Index would shoot higher. As it turns out though, the BMI is falling. That is largely due to four days of abnormal buying momentarily skewing the ratio higher. But as we can see, since October 21st, the ratio hasn’t been overwhelmingly strong:
Graphs are for illustrative and discussion purposes only. Please read important disclosures at the end of this commentary.
This is causing the BMI to drift casually lower:
Graphs are for illustrative and discussion purposes only. Please read important disclosures at the end of this commentary.
This might cause some concern along with softer markets since the initial exuberance, so let’s check in on the health and ranks of the sectors to see if we can glean some more information.
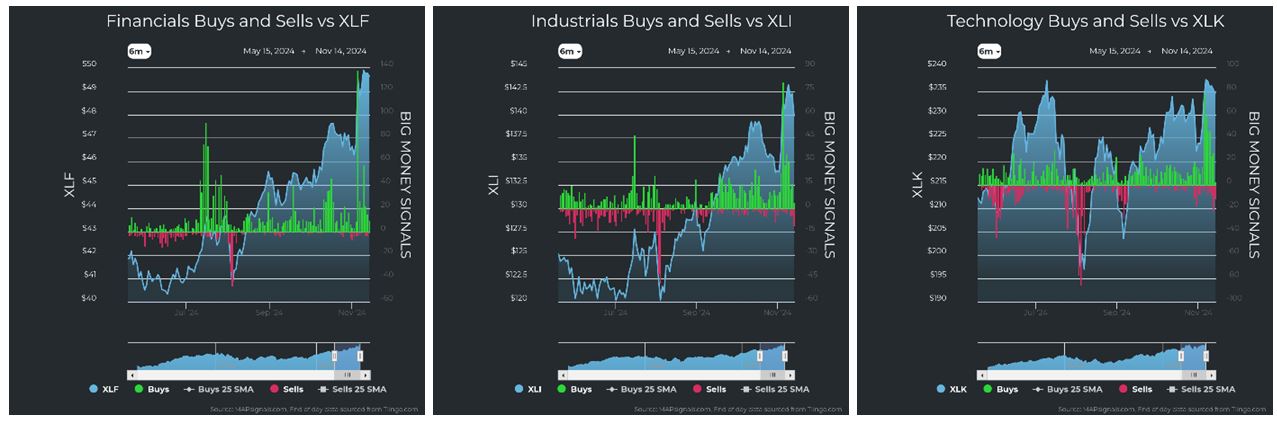
The first thing to note is that Financials are exploding higher. With the possibility of less regulation and more M&A, along with higher than average rates, banks stand to do well:
![]()
Graphs are for illustrative and discussion purposes only. Please read important disclosures at the end of this commentary.
We also see that Industrials, Technology, and Discretionary sectors round out the top four (of 11). This is bullish, as these growth sectors are the engines of longer-term bull markets. They represent a robust and growing economy with infrastructure projects, technological advancement and a strong consumer.
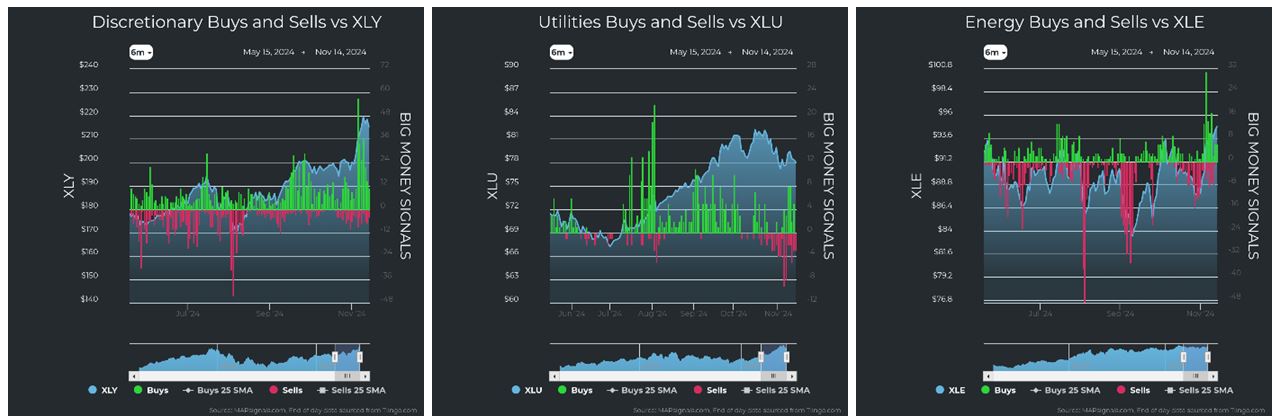
When we look at buying and selling on a sector level, we see mostly strong indicators. The parabolic buying of Financials was brief, but there is no selling to speak of. The same goes for Industrials, Tech, and discretionary stocks:
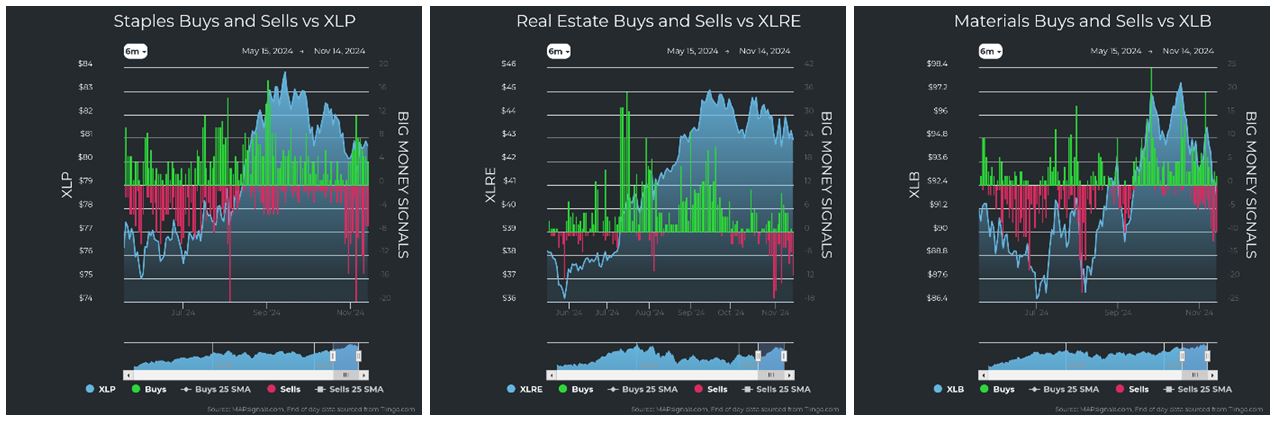
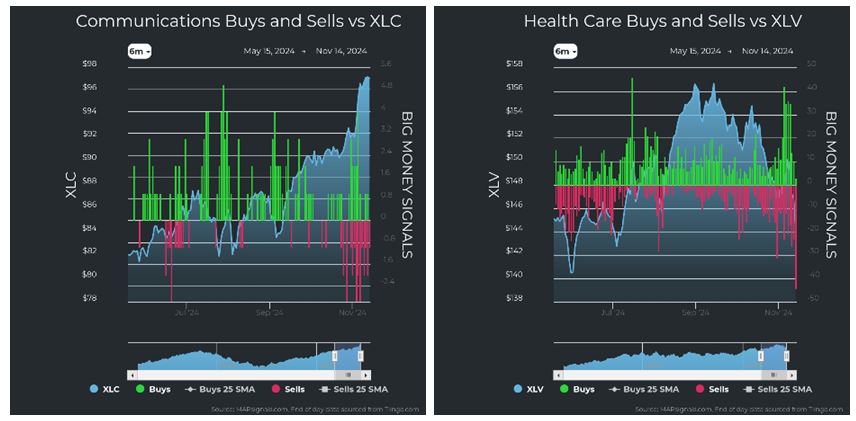
Graphs are for illustrative and discussion purposes only. Please read important disclosures at the end of this commentary.
The only signs of selling are Staples, Materials, and Health Care. Overall, sectors are strong, and we see more buying than selling, so despite a falling BMI and fading market, under the hood – things look fine.
OK, so we have mixed messages. First, we saw big buying, which launched stocks higher. Now they are fading, and we see some spots of weakness. What should we make of all this?
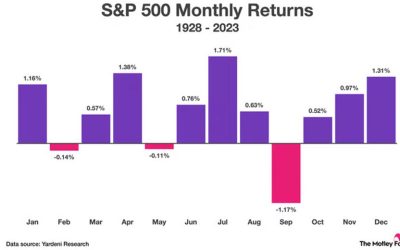
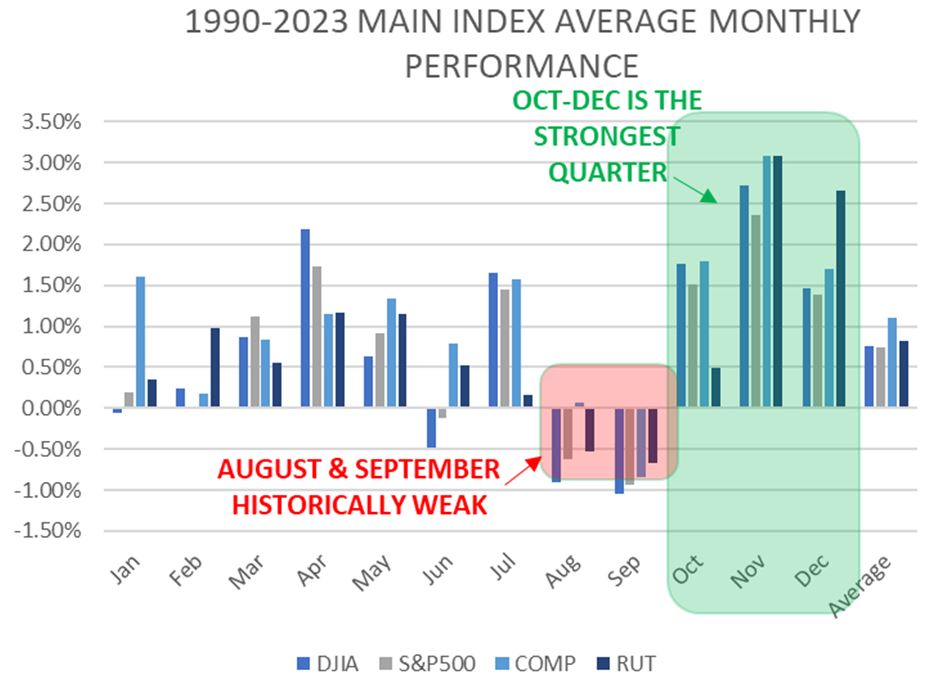
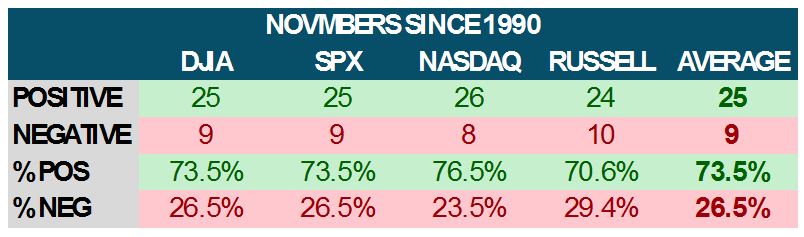
First off, here’s my 100th reminder that we are in the seasonally strongest time of year. November, in particular, since 1990, is the strongest month of the year, up an average 2.82% across all indexes:
Graphs are for illustrative and discussion purposes only. Please read important disclosures at the end of this commentary.
Also, the fourth quarter is the strongest quarter, followed by the first quarter, January – March. April is also a seasonally strong month, so we are beginning the market’s strongest six-month stretch, November through April, providing major seasonal tailwinds.
Let’s not forget we also have falling interest rates too, and a business- and tax-friendly administration coming. These are additional tailwinds for stocks.
But what about that fading rally? Is the Trump 2.0 trade all over – in four or five days? Well, let’s look deeper than daily totals. Let’s examine the explosive buying and see what it may hold for the future.
For seven consecutive days, unusual buys were over 100:
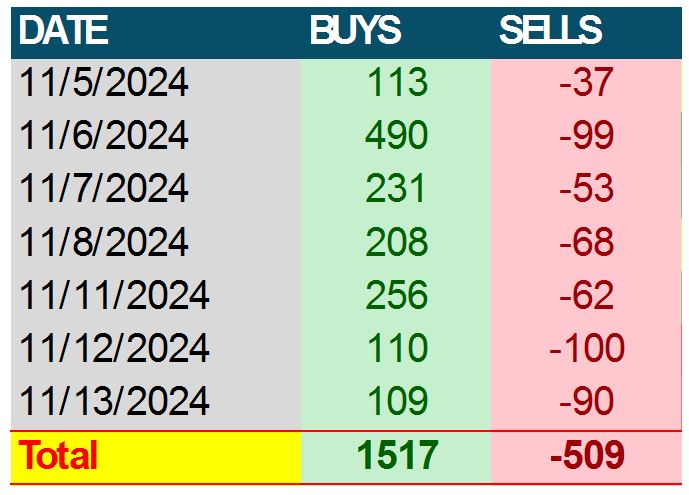
Graphs are for illustrative and discussion purposes only. Please read important disclosures at the end of this commentary.
The average worked out to over 200 unusual buys per day. I wanted to look at similar times in history when this happened. I found 31 times prior, spanning 2009 to 2023. The forward returns on average for these times was very strong, and they were positive a vast majority of the time:
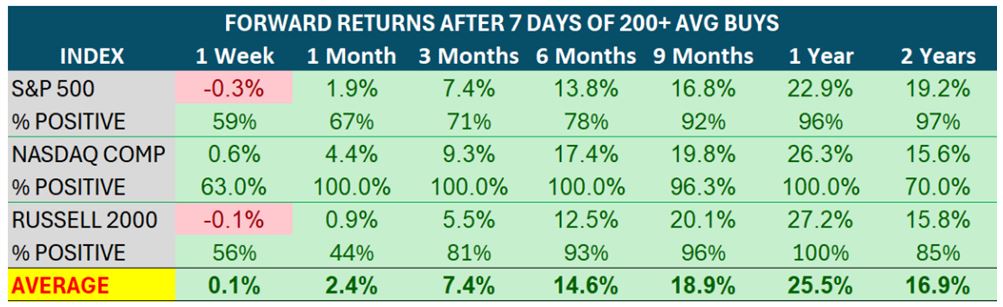
Graphs are for illustrative and discussion purposes only. Please read important disclosures at the end of this commentary.
As exciting as that was to see, there is also a problem: Volumes have been steadily increasing since 1990, when my data set begins, so I had to normalize the buying to find similar setups prior to 2009 (remember that huge post-2008 rally?). I found that the seven strong buy days in November accounted for 10% of the buys for the prior trading months (I used 20 trading days – about four weeks).
I looked for similar times and found many more instances. There were 414 prior times like these, and they spanned a much broader time frame. In fact, the only four (of 34) years this didn’t happen.
The forward returns after six months to two years were just shocking:
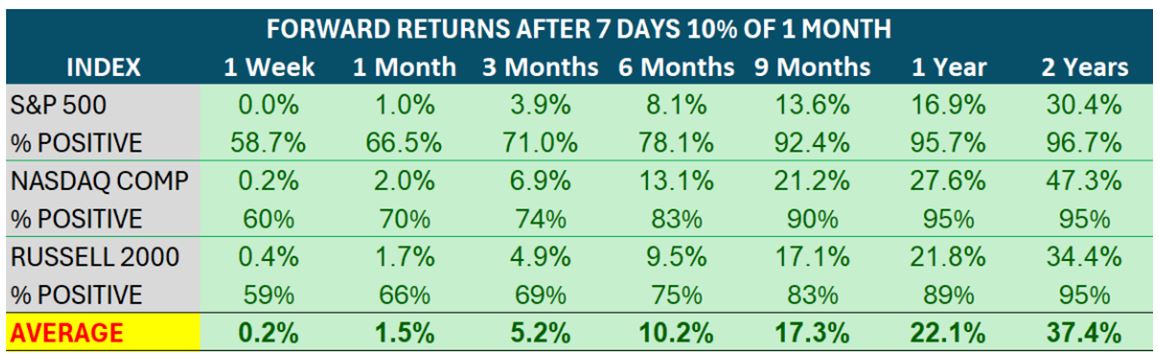
Graphs are for illustrative and discussion purposes only. Please read important disclosures at the end of this commentary.
To me, this data signals that we should use any dips as a buying opportunity, so don’t listen to the negative crowd; listen to the positive data. It tells us to be excited about stocks.
Max Lucado said: “A man who wants to lead the orchestra must turn his back on the crowd.”
The post 11-19-24: We’re Entering the Best Season for Stocks appeared first on Navellier.