by Gary Alexander
November 5, 2024
Last week, we learned about GDP growth and job growth, but the headlines were more like head fakes.
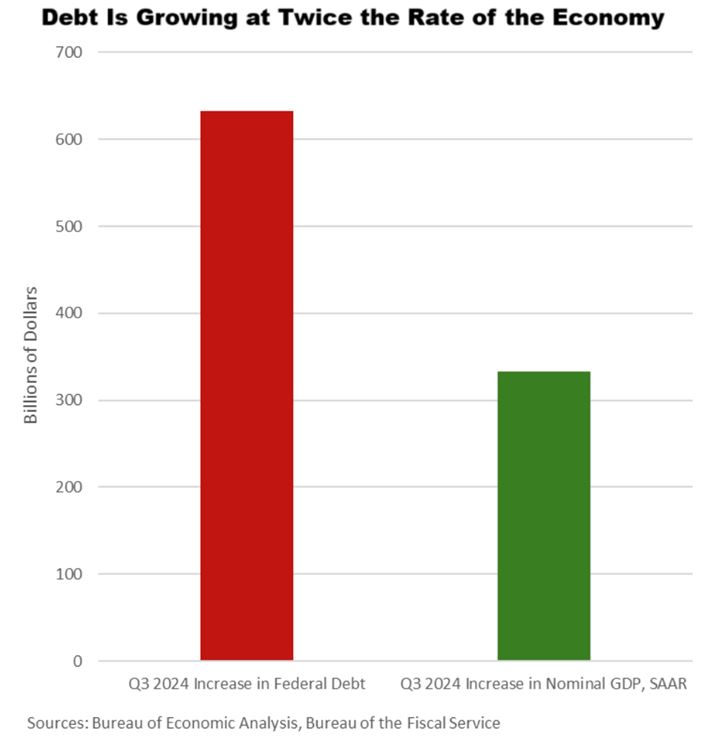
First, the GDP headline mentioned 2.8% annualized GDP growth for the third quarter of 2024, which was a gift to the Biden/Harris team, but the details weren’t that kind to the incumbents. Government purchases (excluding transfer payments) grew at 5%, double the pace of the private sector’s 2.5%. Government spending growth has now surpassed consumer spending growth in eight of the last nine quarters.
In addition, the federal debt continues to increase about twice as fast as GDP, pushing our cumulative federal debt over $35 trillion, with neither candidate ever addressing their desired major cuts in spending.
Graphs are for illustrative and discussion purposes only. Please read important disclosures at the end of this commentary.
As if this weren’t bad enough, the Treasury Department announced last week that the federal government plans to borrow another $1.369 trillion over the next six months – a $2.74 trillion annual rate, bringing the national debt to $38 trillion this time next year. (Someday, they’ll auction a bond, and nobody will buy it).
Turning to Friday’s jobs report, we saw another head fake, with a net “gain” of 12,000 jobs, but on closer examination, we saw private jobs decline for the first time since the government-imposed lock-downs of 2020. Private jobs fell by 28,000, while government jobs grew by 40,000, reaching a new record high.
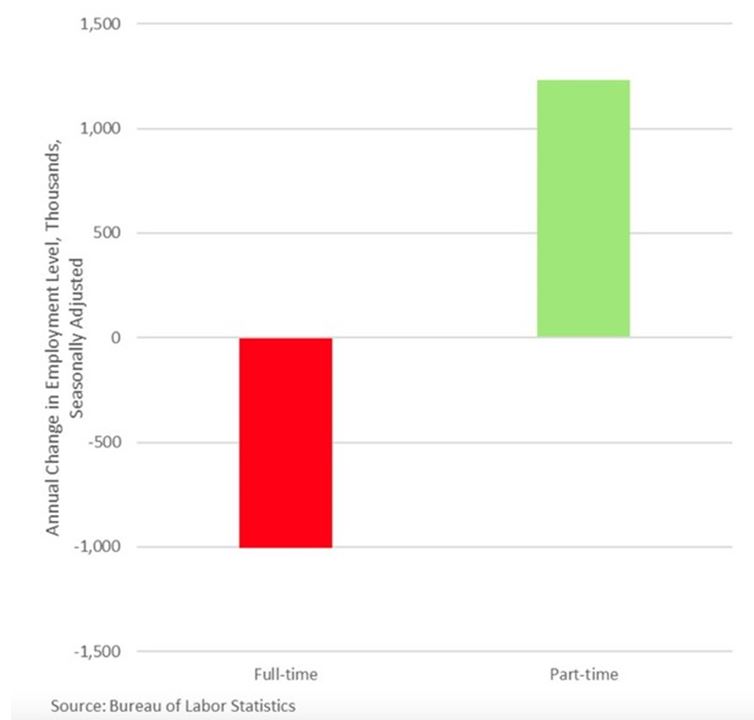
The more you dip into the details, the worse the story gets, first, because the previous two months were revised downward by 112,000 jobs, and almost all the lost jobs were in construction, manufacturing, and business services. Despite claims of manufacturing job gains, that sector has lost 184,000 jobs since January 2023. Government jobs and government-dominated healthcare jobs accounted for almost two-thirds of recent job growth, while professional and business services, plus manufacturing, all showed annual job losses. This isn’t a robust private-sector recovery. After healthcare and government, the next fastest-growing job category is low-paying leisure and hospitality. And the biggest shock is that the number of part-time jobs make up the entire job gain picture, and then some, since the start of 2023.
Graphs are for illustrative and discussion purposes only. Please read important disclosures at the end of this commentary.
Also, according to the BLS, native-born U.S. citizens have lost 773,000 jobs over the past 12 months, while foreign-born citizens or non-citizens gained 1,034,000 net new jobs. And if Trump wins, fulfilling his promise to deport some of those workers and close the borders, who will take up the job slack? A major new trend is that many young U.S. citizens prefer working part-time, off the books, or not at all.
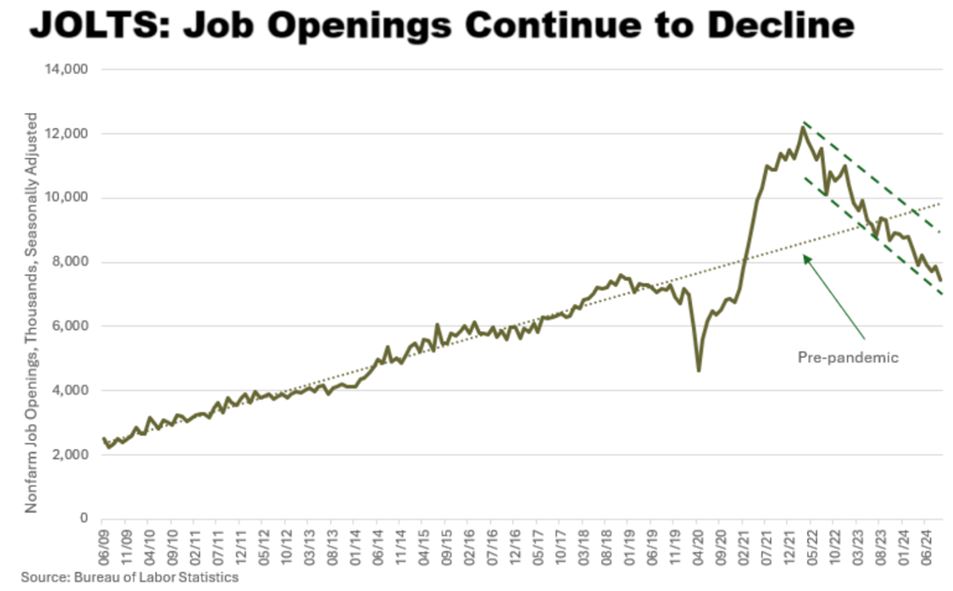
The job opening picture is also turning dismal. The JOLTS report showed that job openings are now at their lowest level since early 2021 and below end-2018 levels. Openings have been trending down since early 2022, as have quits, which are now at the lowest level (excluding the Covid year) since early 2018.
Graphs are for illustrative and discussion purposes only. Please read important disclosures at the end of this commentary.
Stock Market Gains – The Best Election Year Since 1936!
One growth number is for real: Through October 31, the S&P Growth Index is up a spunky 30.83% vs. less than half that, +14.36%, for S&P Value Index, according to Bespoke Investment Group. The same source told us that through October 31, this crazy 2024 campaign year is the best election year since 1936, with the S&P 500 up 19.6% and NASDAQ up 20.5%. However, Bespoke also tells us, there was no late-year follow-up to FDR’s big win, as the market dropped 0.3% in the final two months of 1936.
As I’ve documented here recently, the market has risen handsomely in the last three election years:
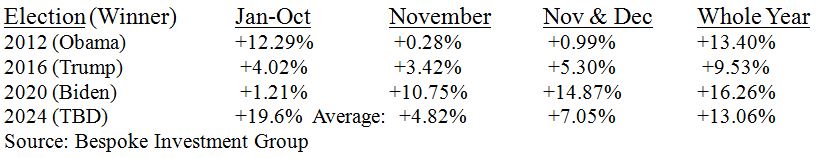
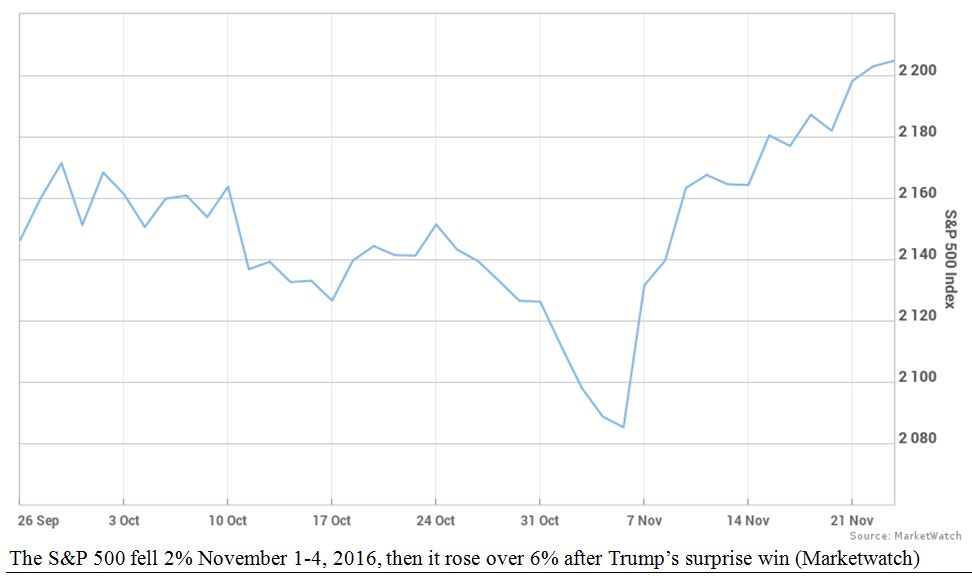
The late-year recoveries in 2016 and 2020 were quite dramatic, especially considering that the 2016 Trump victory was such an unexpected upset. As the Trump win began to sink in, New York Times Nobel-Prize winning economist Paul Krugman made a stunning prediction on the Times’ election night blog:
“It really does now look like President Donald J. Trump, and markets are plunging. When might we expect them to recover? Frankly, I find it hard to care much, even though this is my specialty. The disaster for America and the world has so many aspects that the economic ramifications are way down my list of things to fear. Still, I guess people want an answer: If the question is when markets will recover, a first-pass answer is never.” – Paul Krugman, writing at 12:42 am, Wednesday, November 9, 2016.
P.S. Over the next week, the Dow and S&P 500 each hit all-time highs and just kept rising.
Graphs are for illustrative and discussion purposes only. Please read important disclosures at the end of this commentary.
Another Nobel Prize winning economist – one of the 2024 winners, just announced – also predicted a major market crash and recession if Donald Trump were elected in 2016. Writing on October 29, 2016, barely a week before the election, Simon Johnson, one of this year’s Nobel Prize winning economists, wrote an article entitled, “The Consequences of a Trump Shock.” Here is his opening paragraph in full:
““With the United States’ presidential election on November 8, and a series of elections and other political decisions fast approaching in Europe, now is a good time to ask whether the global economy is in good enough shape to withstand another major negative shock. The answer, unfortunately, is that growth and employment around the world look fragile. A big adverse surprise – like the election of Donald Trump in the US – would likely cause the stock market to crash and plunge the world into recession.”
–– 2024 Nobel-Prize winning economist Simon Johnson, October 29, 2016
Nope, no crash, no recession. So, how can two Nobel Prize winners (and others I could list) be so wrong? Probably because many of these group-think guys tend to bloviate in line with their political affiliations, ignoring the tools of their trade. In 2021, 17 Nobel Prize economics laureates strongly endorsed the Biden “Build Back Better” plan, and an even larger gaggle of Nobel laureates signed a letter saying the 2024 Kamala Harris economic agenda (unclear as it may be) is “vastly superior to the counter-productive agenda of President Trump,” since Nobel winners are a self-generating lot: Past winners nominate future candidates. (See “Nobelists for Harris Are Unburdened by Proof,” Wall Street Journal, October 30, 2024).
Three Possible Election Outcomes – From 200, 100 and 50 Years Ago This Week
Let me close with some notable election results from 200, 100 and 50 years ago this week – one disputed (even robbed, one could say) in 1824, a Republican sweep in 1924, and a Democratic sweep in 1974:
- On November 2, 1824, the Popular vote was recorded for the first time, but it was irrelevant, as Tennessee General Andrew Jackson beat John Quincy Adams in electoral votes, 99 to 84. Since Jackson failed to win 50%, there was some wheeling and dealing too complex to cover here, and in early 1825, the House declared Adams the winner. Jackson fumed, coming back to win in 1828.
How interesting – the son of a President (John Adams), separated only by a middle initial (Q) beat a candidate from Tennessee by insider dealing – shades of George “W” Bush beating Al Gore in 2000?
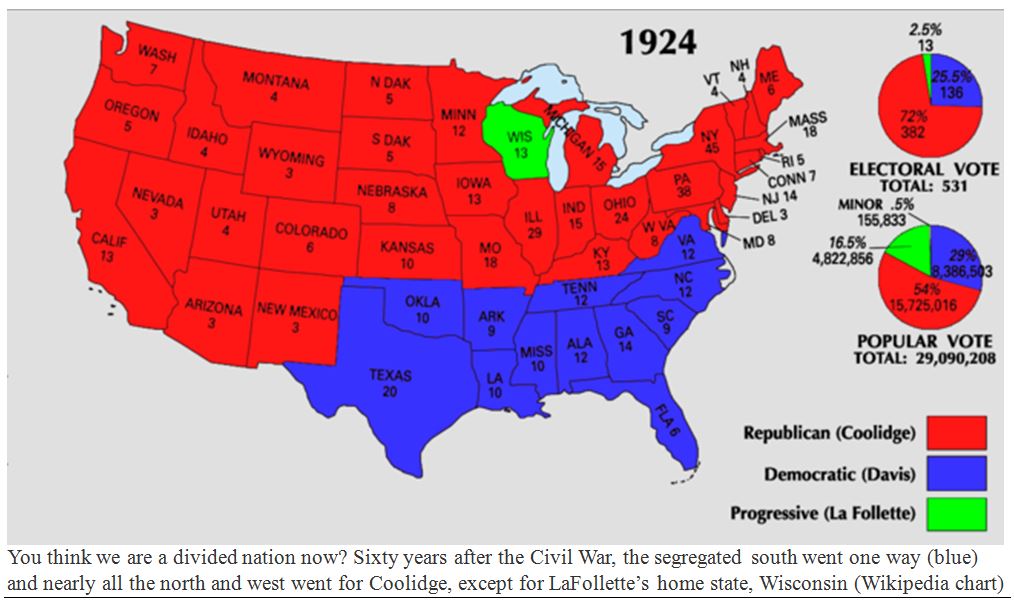
- On November 4, 1924: Calvin Coolidge was re-elected with 54% of the vote, despite running against five other candidates: Democrat John W. Davis (with 29%), Progressive Robert LaFollette (16.5%), and three minor party candidates sharing 0.5%. Coolidge won 35 northern and western states, all but LaFollette’s home state, Wisconsin, while Davis swept the 12 southern states. On the same day, Nellie Tayloe Ross and Miriam Ferguson were elected the first female governors (in Wyoming and Texas).
Graphs are for illustrative and discussion purposes only. Please read important disclosures at the end of this commentary.
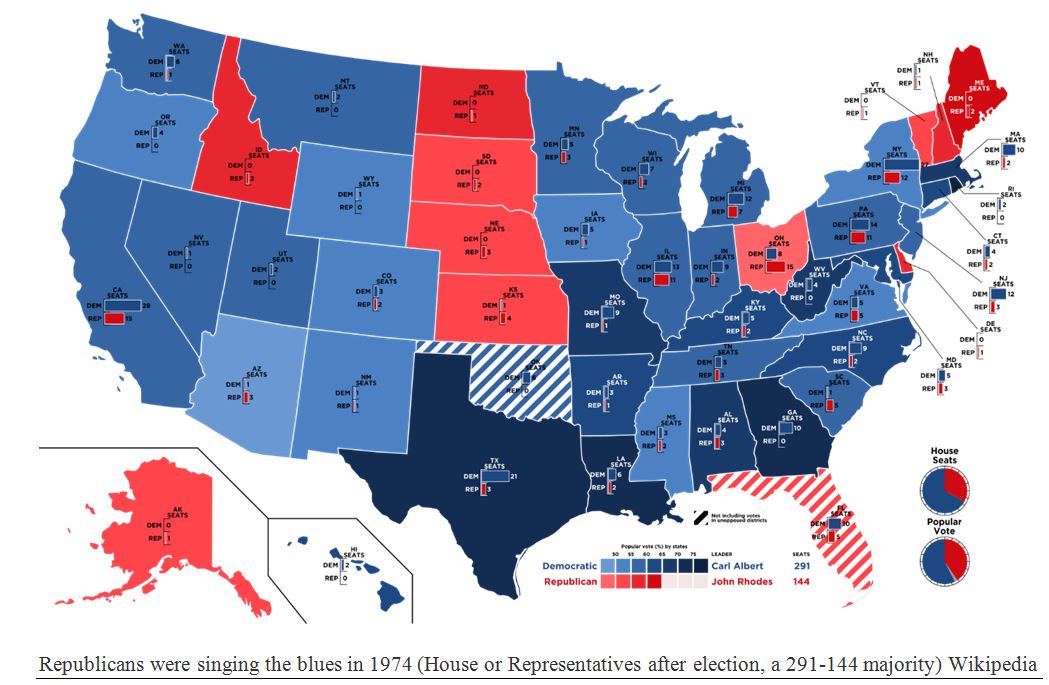
- On November 5, 1974, in reaction to the Watergate scandal, Democrats gained a 2:1 majority in the House, gaining 43 seats to reach a 291-to-144 majority. The ratio was also high in the Senate, 61-37, with two independents. On the state level, Democrats won four more governor-ships, for a total of 36 (to 13 Republicans). The Dow reached its nadir of 577.6 within a month of this Democratic landslide.
Graphs are for illustrative and discussion purposes only. Please read important disclosures at the end of this commentary.
What will happen this year? A long dispute, Red State Regrets or Blue State Blues? We’ll soon know…
The post 11-5-24: What is Growth and What is a Mirage? appeared first on Navellier.